How Seattle-area demographics have changed since 2000

Add Axios as your preferred source to
see more of our stories on Google.
 Open embedded content from datawrapper.dwcdn.net
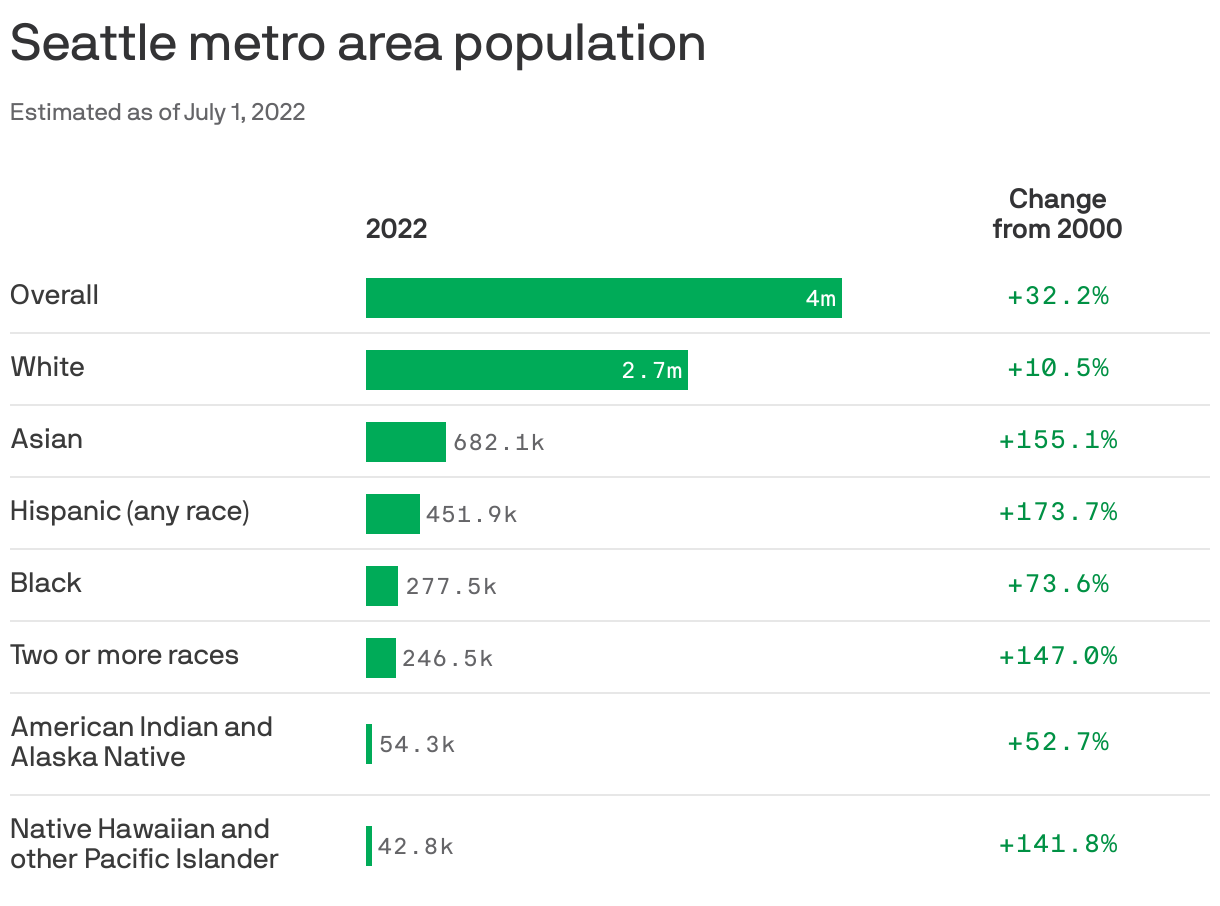
The Seattle metro area's Hispanic, Asian and multiracial populations saw the biggest percentage increases between 2000 and 2022, per a new analysis from Axios' Kavya Beheraj and Alex Fitzpatrick.
Why it matters: Such demographic data is a vital snapshot of how the Seattle-Tacoma-Bellevue metro area's racial and ethnic makeup is changing over time, helping to inform policies and programs across the region.
By the numbers: The region's number of Hispanic residents grew 174%, to 451,948.
- The Asian population grew about 155%, to 682,086.
- And the population that identified as being two or more races grew about 147%, to 246,495.
Plus: The region's Native Hawaiian and Pacific Islander population also more than doubled, from 17,699 to 42,805.
Driving the news: Demographic trends are driven by a combination of factors, including varied birth, mortality and immigration rates (both internal and external) among different socioeconomic groups.
The big picture: Nationwide, the country's Pacific Islander, Asian and Hispanic populations similarly saw the biggest percentage increases between 2000 and 2022.
- The number of Native Hawaiian/Pacific Islanders grew about 120%, to nearly 879,000, while the Asian population grew about 105%, to 21 million.
- The Hispanic population grew about 80%, to nearly 64 million.
- The Black population grew 31%, to 45.4 million.
Of note: The U.S. is still predominantly white, with growth of 19% between 2000 and 2022, to nearly 252 million.
- In the Seattle metro area, about 60% of the population was non-Hispanic white in 2022.
Meanwhile: The country is also rapidly aging, Axios' Emily Peck recently reported, with the median age reaching a record 38.9 last year.