How income has changed generationally for Fort Worth and Dallas residents


Add Axios as your preferred source to
see more of our stories on Google.
Fort Worth residents born to low-income families are faring worse than the previous generation, per a Harvard University analysis.
- It matches a national trend.
Why it matters: Intergenerational mobility — the idea that you'll do better than your parents, your children will do better than you, and so on — is core to the American dream.
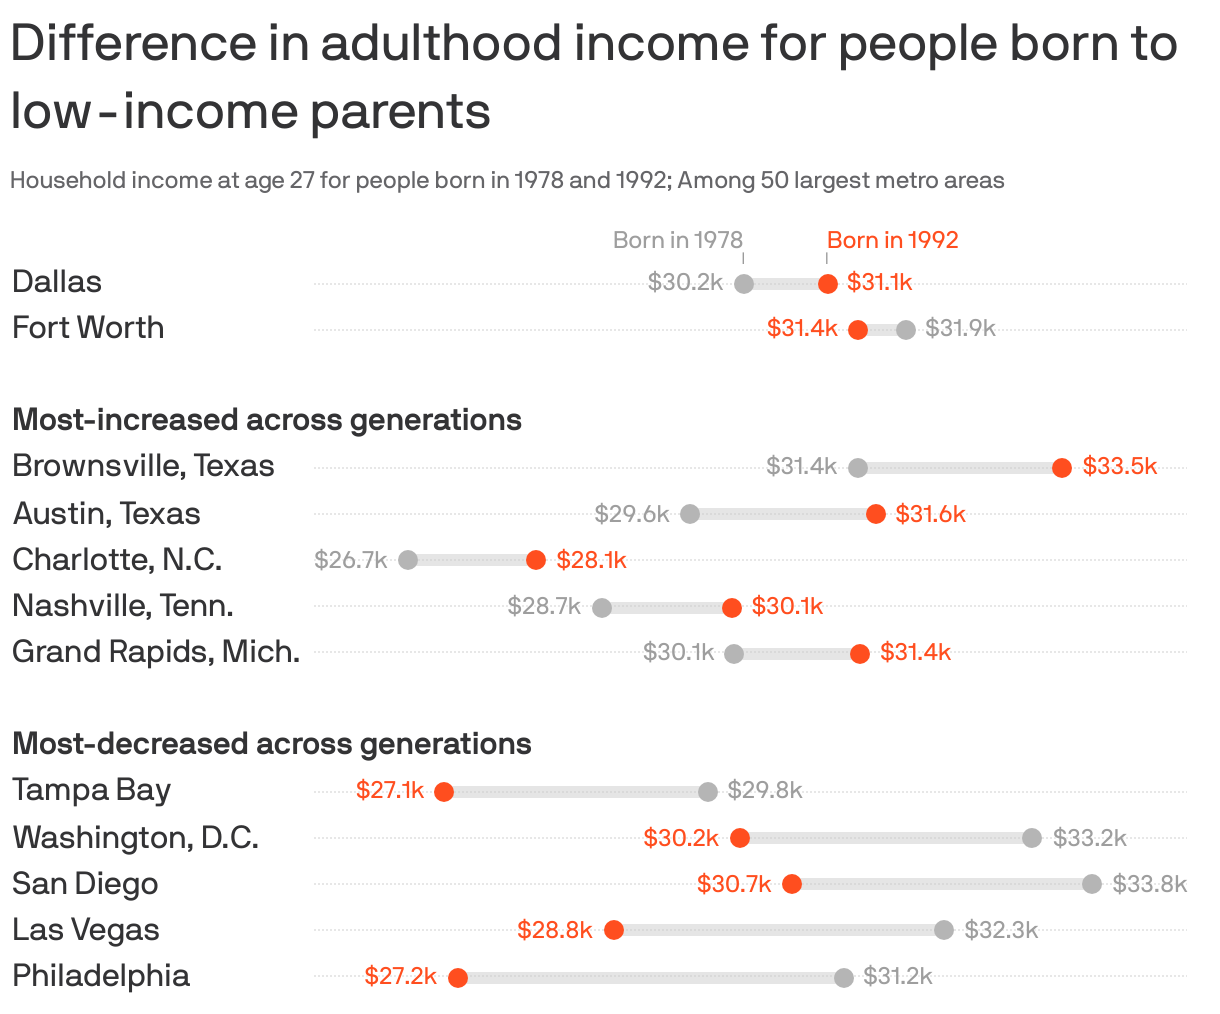
The big picture: In 38 of the 50 biggest U.S. metro areas, Americans born to low-income families in 1992 were doing worse at age 27 than those born in 1978 at that age, per an analysis from the Census Bureau and Opportunity Insights, a research group at Harvard University.
- A few Texas cities, including Dallas, buck the national trend.
What they did: Researchers compared the average household income at age 27 for Americans from low-income families in both 1978 and 1992 to get a localized picture of changing opportunities over time.
- Brownsville, Texas, saw the biggest increase across generations: Those born in 1992 made $33,500 at age 27, compared to $31,400 for those born in 1978. The pay increased 6.7%, adjusted to 2023 dollars.
What they found: In Fort Worth, people born to low income parents in 1992 made $31,400 at 27, down from $31,900 for people born in 1978.
- Dallas pay increased slightly. Dallasites born in 1992 made $31,100 at 27, up from $30,200 for people born in 1978.
Reality check: Even though some North Texans born into low-income families fared better than their parents, their average hourly wage hovered around $16.
- The living wage for an individual in the Dallas-Fort Worth area is about $22.
The intrigue: While wage opportunity decreased for lower-income people in Tarrant County, people born to high-income families saw their pay increase.
- Black people born in high-income families saw the largest increase.
- In Dallas County, Black people born in low-income families saw an increase in pay, whereas white people born in low-income families saw a decrease, the researchers wrote.
Between the lines: The geography of mobility has shifted dramatically, especially when breaking down the data by race.
- For example, upward mobility for low-income white children on the coasts fell to rates typically seen in Appalachia.
- "Conversely, for Black children, upward mobility increased the most in the Southeast and the Midwest — areas where outcomes had historically been poorest for Black Americans," the researchers wrote.
Yes, but: "Black children born in 1992 still had poorer prospects of rising up than white children in virtually every county in America, because initial Black-white disparities were so large."
Go deeper: Explore the interactive Opportunity Atlas tool.