3D digital models are resurrecting lost neighborhoods

Add Axios as your preferred source to
see more of our stories on Google.
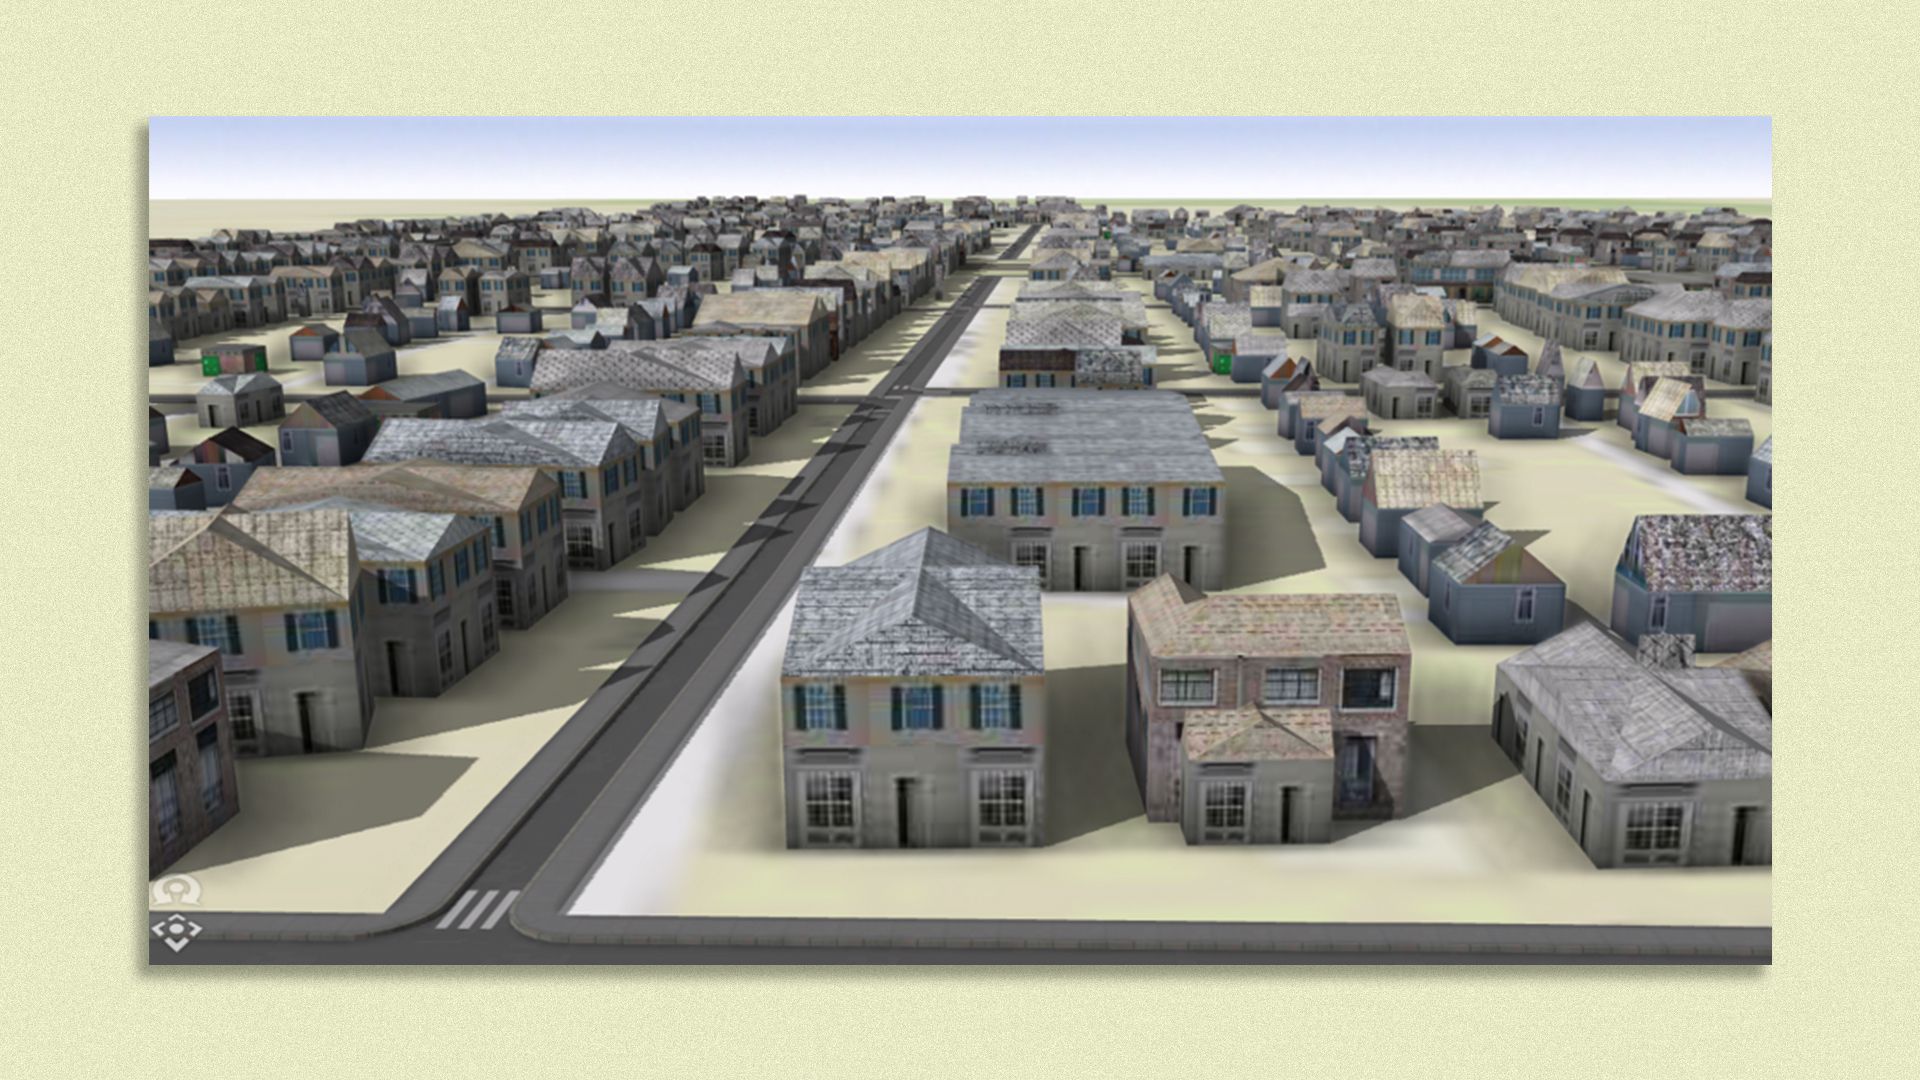
Image courtesy of Ohio State University's Center for Urban and Regional Analysis
Using a revolutionary new AI-powered method, researchers are mining old insurance maps to visually reconstruct "ghost" neighborhoods — with promising results.
Why it matters: The process could help with efforts to better estimate the economic loss caused by the demolition of historically diverse neighborhoods nationwide.
- It could also humanize that oft-forgotten history, bringing it to life in a way that raw data and spreadsheets simply cannot.
How it works: The technique involves using machine learning algorithms to mine digitized 19th- and 20th-century fire insurance maps — effectively creating 3D computer models of long-lost places.
- Using the technique, researchers can pinpoint a since-destroyed building's location and footprint, plus figure out how many floors it had, the construction materials used, and its overall purpose.
- The system harnesses Sanborn Fire Insurance Maps, which are highly accurate and were originally created to gauge American cities' fire liability.
For example: In a PLOS ONE study published Wednesday, researchers examined two adjacent Columbus, Ohio neighborhoods that once housed a predominantly Black community with many World War II veterans.
- The community was torn apart in the 1960s to make way for an interstate — part of a highway development boom that exacerbated inequality nationwide.
- By comparing the building footprints in 1961 to current built-up areas, they found that 380 buildings were destroyed across the two neighborhoods, including 286 houses, 86 garages, five apartments and three stores.
The big picture: The method can be used to develop 3D digital models for any of the roughly 12,000 American cities and towns with Sanborn maps.
- "Now with machine learning, it is really possible to analyze all of that information at scale ... and that has not been really possible in the past," says study lead author Yue Lin, a former doctoral student in geography at Ohio State who specializes in spatial data science.
What's next: It could also be used to recreate neighborhoods wrecked by disasters such as floods, Ohio State professor of geography and paper co-author Harvey Miller notes, or be useful in modern-day urban planning to reduce the climate-fueled impacts of extreme heat.
- "It's not just for historic purposes, it's also to understand how we move forward and mitigate what are going to be some substantial threats to our cities in the future and to the people who live in them," says Miller.
What we're watching: Miller's team at the Center for Urban and Regional Analysis is working on a 3D digital model of one of the country's first public housing projects, as well as digitally reconstructing a Columbus avenue that housed Black-owned businesses before highway infrastructure reshaped the community.
- Miller expects the 3D visualizations to be accessible as virtual reality photorealistic immersion experiences within a year — people will be able to put on a headset and "walk down the street in one of these neighborhoods," he says.
- The team is also in talks with the Philadelphia Federal Reserve Bank about applying the method to help measure historic economic activity generated by the city's communities of color that were disrupted by urban renewal.
The bottom line: "This is the kind of thing that resonates with people. We could have all the maps, charts and graphs showing numbers. People get it, but they don't feel it," Miller tells Axios.
- "We're trying to give people this visceral feeling."
