Presented by Facebook
Graphing the pandemic

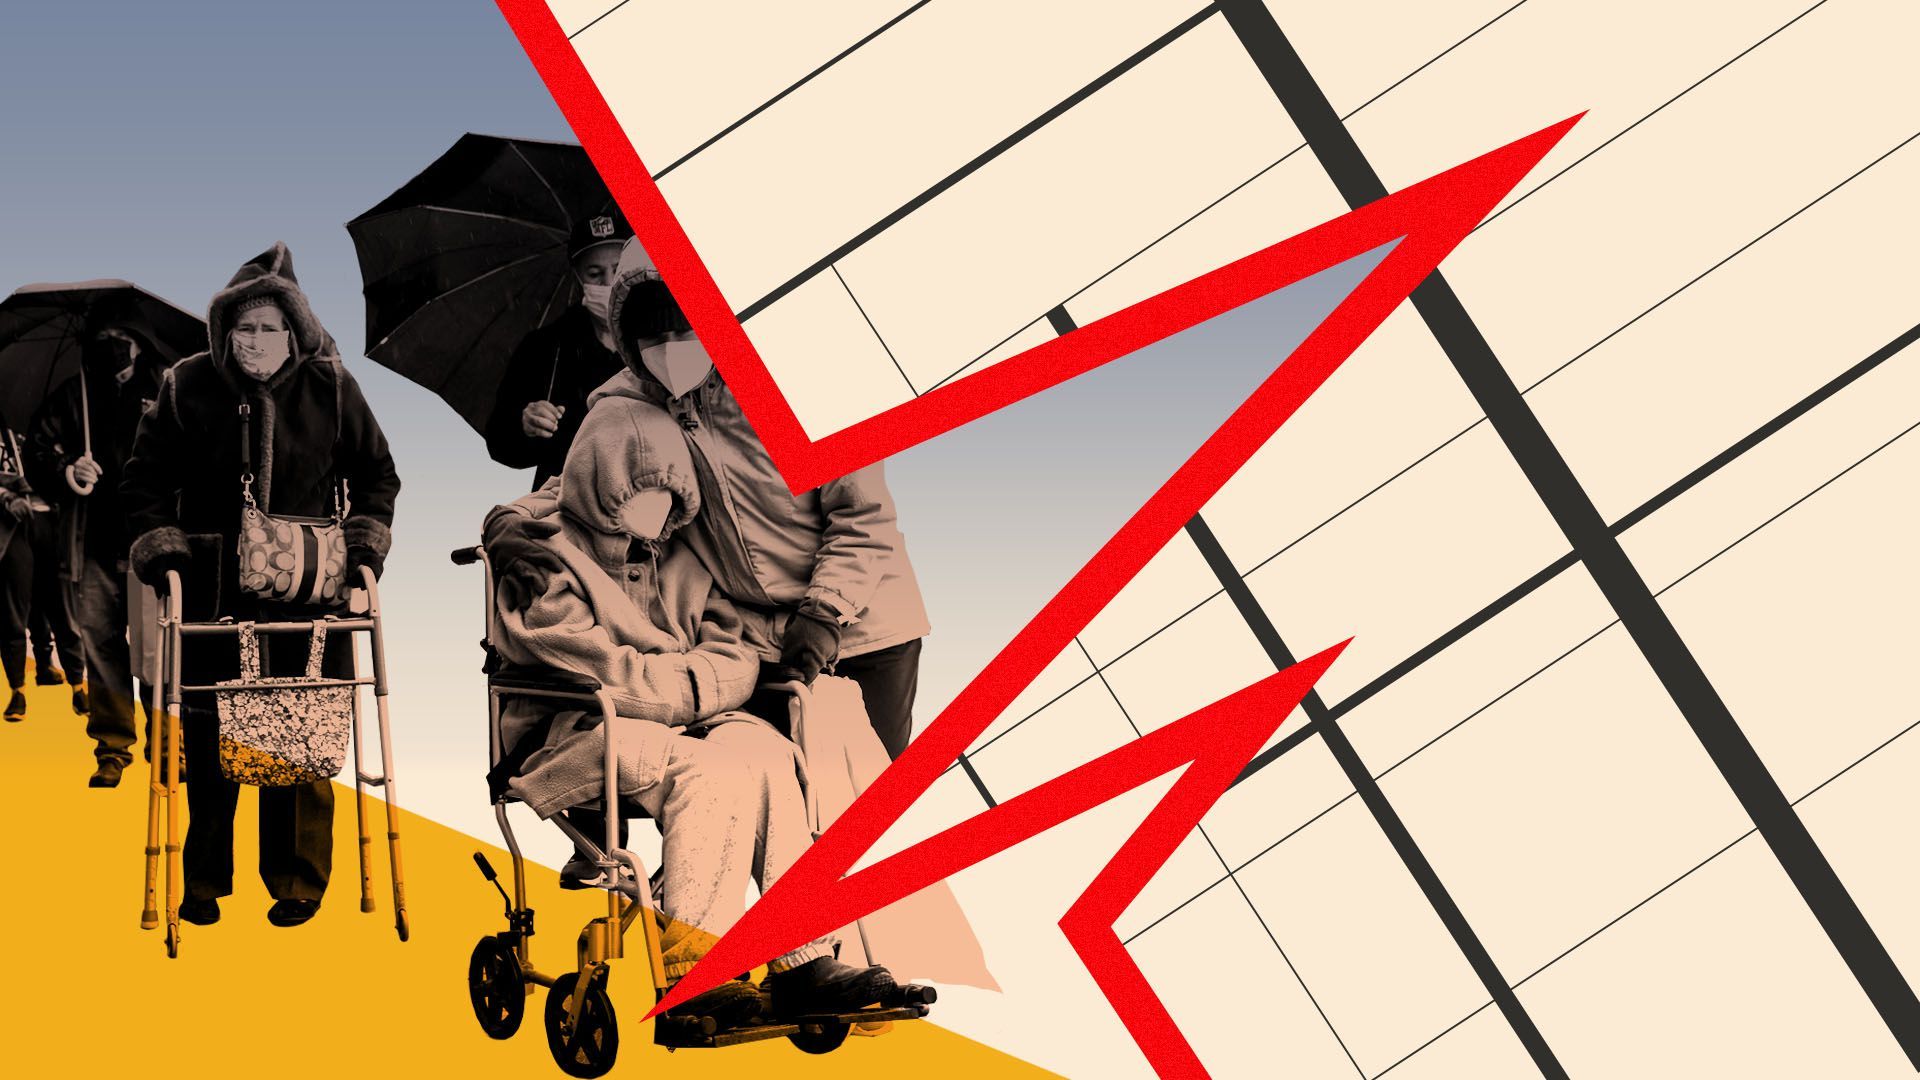
2020 was literally off the charts. Data journalists saw changes that typically take months instead happening in weeks — numbers that will be breaking the y-axis for years to come.
Apr 5, 2021 - Economy
Presented by Facebook