Sign up for our daily briefing
Make your busy days simpler with Axios AM/PM. Catch up on what's new and why it matters in just 5 minutes.
Catch up on coronavirus stories and special reports, curated by Mike Allen everyday
Denver news in your inbox
Catch up on the most important stories affecting your hometown with Axios Denver
Des Moines news in your inbox
Catch up on the most important stories affecting your hometown with Axios Des Moines
Minneapolis-St. Paul news in your inbox
Catch up on the most important stories affecting your hometown with Axios Twin Cities
Tampa Bay news in your inbox
Catch up on the most important stories affecting your hometown with Axios Tampa Bay
Charlotte news in your inbox
Catch up on the most important stories affecting your hometown with Axios Charlotte
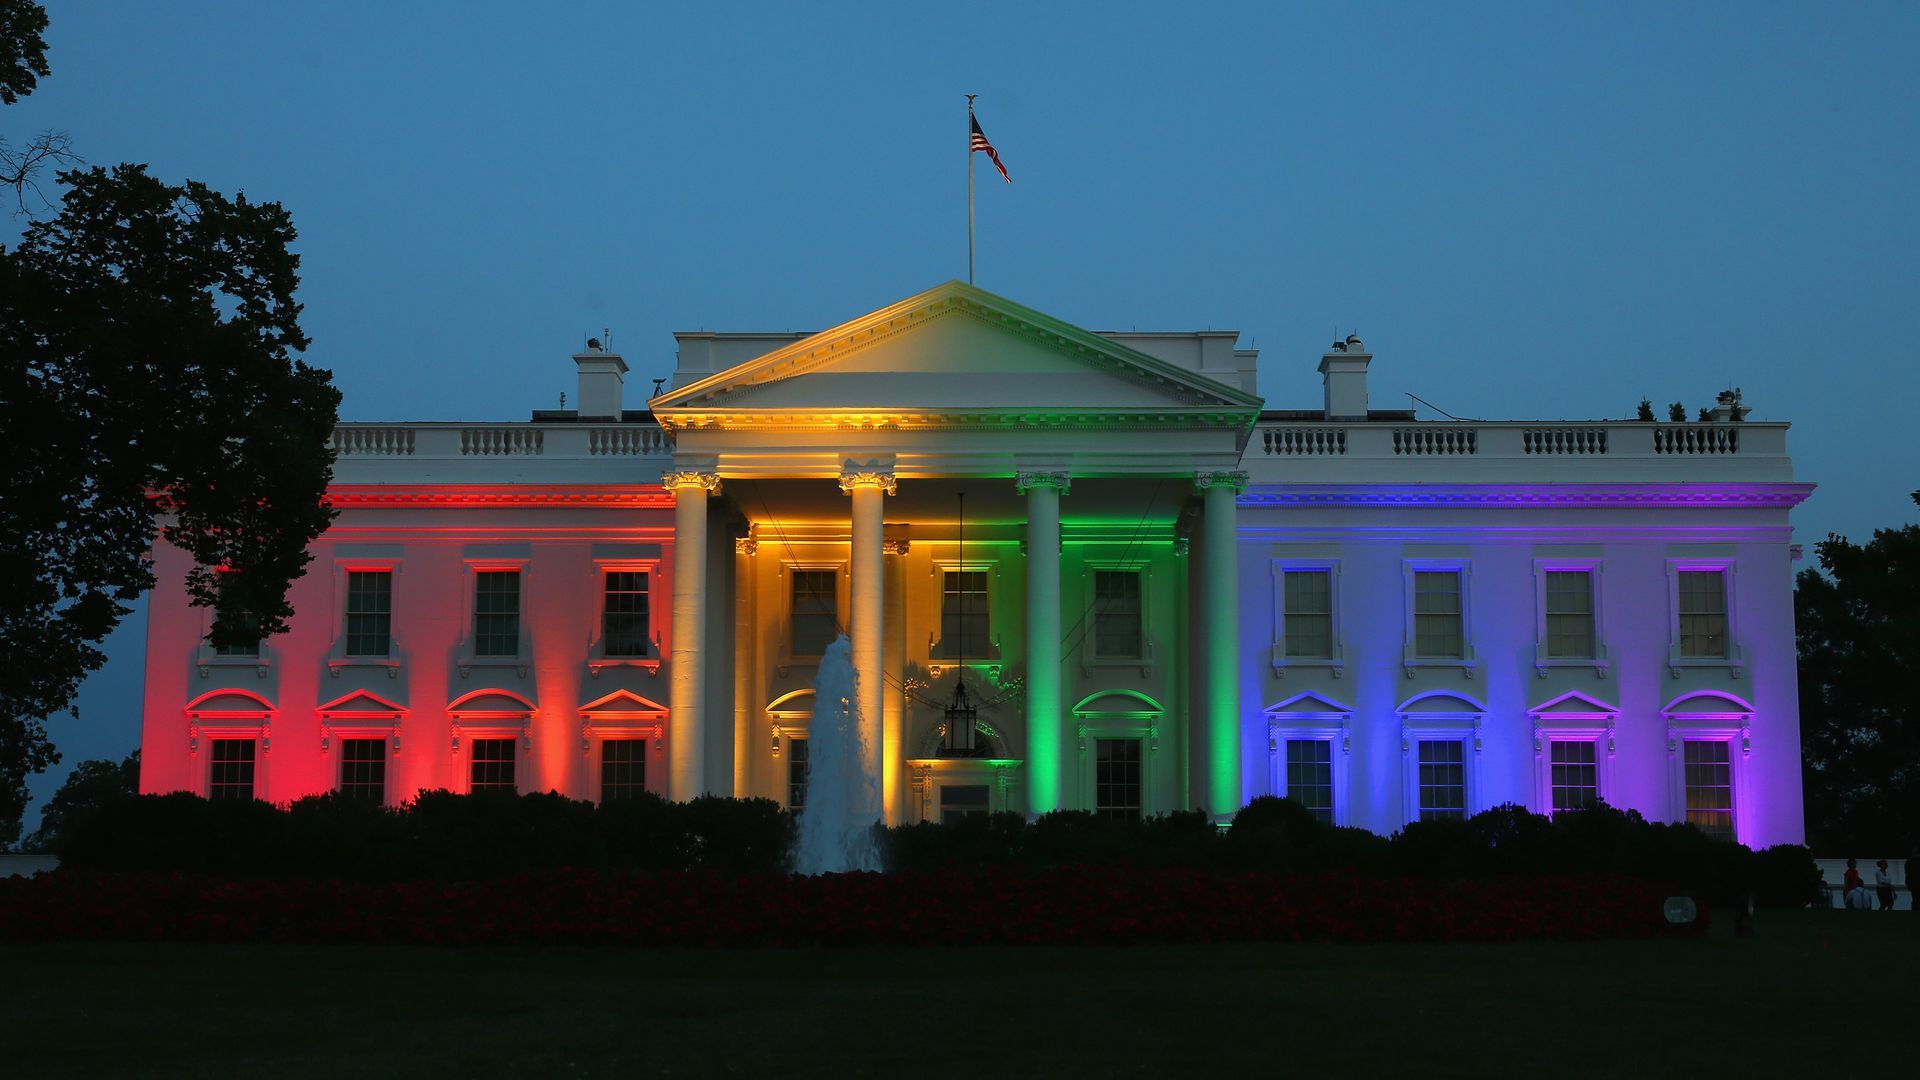
On June 26, 2015, President Obama's aides lit the White House to celebrate the day's Supreme Court ruling in favor of same-sex marriage. Photo: Mark Wilson/Getty Images
The number of married same-sex households in the U.S. was 568,110 in 2019 — up almost 70% since 2014, the year before the Supreme Court legalized same-sex marriage nationwide, AP notes.
The big picture: 58% of the 980,000 same-sex couple households reported in 2019 were married couples.
- D.C. had the highest concentration of same-sex households (2.4%), followed by Delaware (1.3%), Oregon (1.2%), Massachusetts (1.2%) and Washington state (1.1%), according to the American Community Survey.
By the numbers:
- 48: Average age for respondents in same-sex marriages.
- 47: Average age for their spouses.
- 82% identified as white.
- 13%+ were Hispanic.
- Almost 7% identified themselves as Black.
- Almost 4% were Asian.
- 16%+ of same-sex married households were interracial couples, double the rate for opposite-sex married couples.