This is how much San Franciscans pay for electricity


Add Axios as your preferred source to
see more of our stories on Google.
San Franciscans are spending an estimated $282 a month on their home electric bills, per a new Axios analysis of data collected and shared by climate newsroom Heatmap News.
Why it matters: Tensions over rising energy bills and power-hungry AI data centers are emerging as a key political issue, and should be a potent force in this year's midterms.
- Americans are also paying more for other forms of energy, like gasoline, amid the Iran war — though the ceasefire deal could lead to some relief, if it holds.
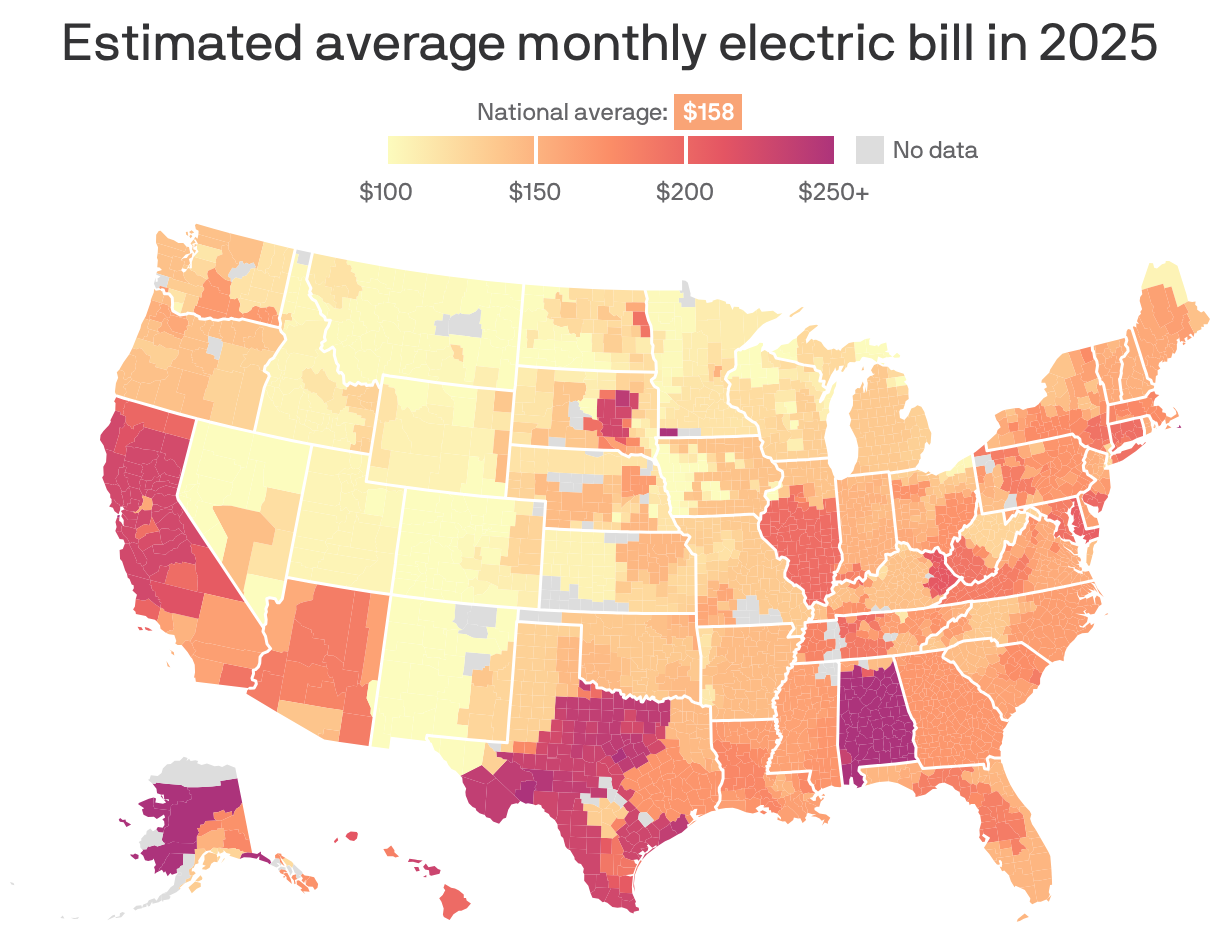
Zoom in: San Francisco had the second-highest estimated average monthly electric bills in the continental U.S. across 2025, surpassed only by Nantucket County, Massachusetts ($296).
- That figure jumped 131% from January 2021 to January 2026, per HeatMap News' report.
Between the lines: The rate hikes are part of why San Francisco is seeking a split from PG&E, though the timeline for achieving it remains unclear.
The intrigue: Counties in Alabama and Texas are some of the most expensive, broadly speaking.
- Alabama's electric bills are relatively steep, partly due to higher consumption and the state's rate structure, per local news outlet WBRC.
What we're watching: Whether efforts to contain energy prices — like forcing tech companies to foot the bill for their AI power needs — actually work.
Methodology: Heatmap News provided Axios with a dataset of average electrical bills by utility company.
We identified which utilities serve each ZIP code by using OEDI crosswalks. When multiple utilities operated in a ZIP code, we averaged their reported bills. This assumes each utility serves an equal number of customers within the ZIP code, which may not hold.
We then mapped ZIP codes to counties using HUD ZIP-to-county files, which provide the share of each ZIP code's households located in each county. Household counts by ZIP code were estimated using U.S. Census data and HUD county-to-ZIP relationship files.
Using these inputs, we calculated county-level averages by weighting each ZIP code's average bill by its number of households and the share of those households in the county.
For counties without ZIP codes in the OEDI crosswalks, we used EIA data on which utilities operate in each county and calculated a simple average of their bills. This again assumes equal customer counts across utilities.