Where SF's most life-threatening crashes are happening

Add Axios as your preferred source to
see more of our stories on Google.
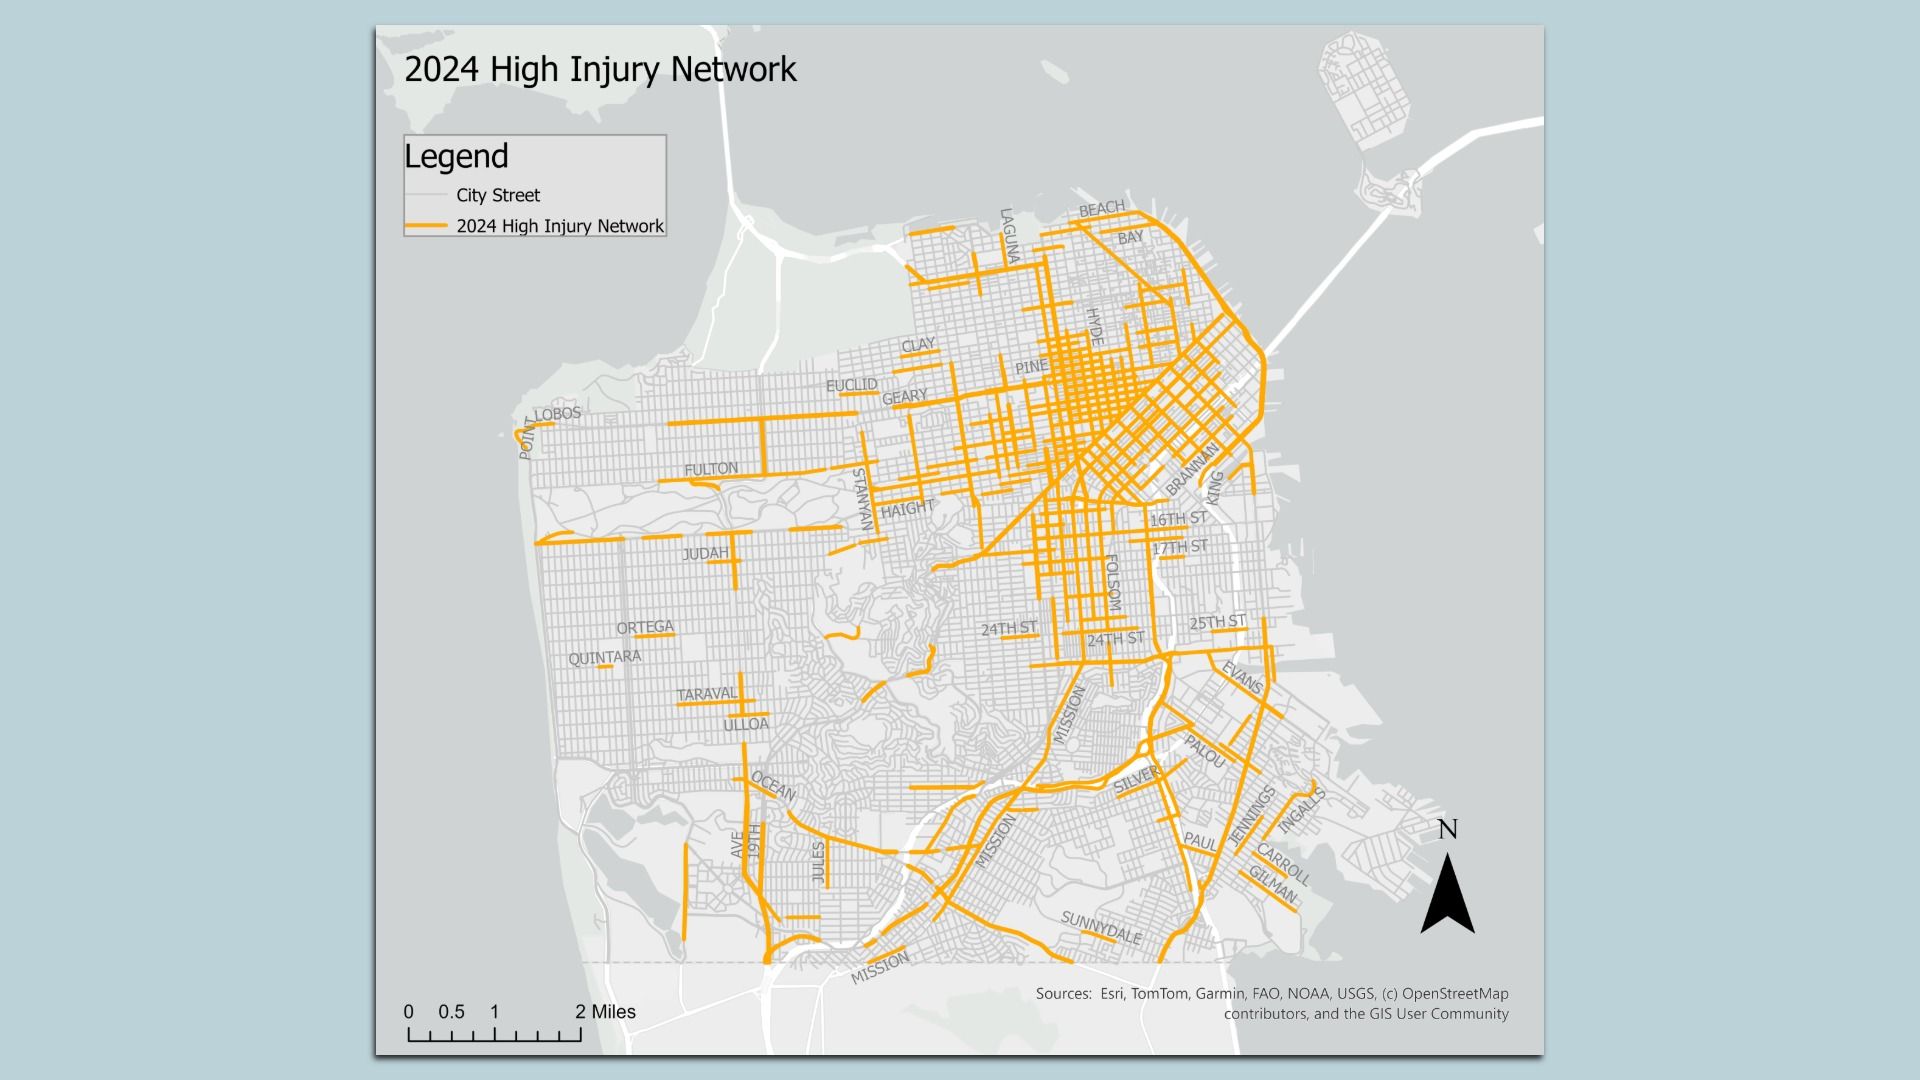
Image: Courtesy of SFMTA
Thirteen percent of San Francisco streets are now responsible for 74% of the city's worst crashes, per an updated map of high-injury roadways released Thursday by the mayor's office.
Why it matters: The new map will shape the city's priorities for targeted street safety improvements amid a recent string of high-profile pedestrian fatalities, which has renewed attention on persistent street safety concerns.
How it works: The High-Injury Network (HIN), last updated in 2022, highlights city corridors with the highest concentration of severe and fatal injuries.
- Streets are considered high-injury if 10 or more people were killed or seriously injured, regardless of whether they're a pedestrian, driver or cyclist.
- The new map is based on data from 2020 to 2024 using police reports, hospital records and details from emergency medical responses.
Street segments that are newly defined as high-risk include:
- Ocean and Mission
- Portola Street
- Fulton Street between 4th and 7th avenues
- The strip of Stanyan north of Fulton
- The Embarcadero between Howard Street and Pier 40
- The west side of Geary Boulevard
- Alemany Boulevard
- Point Lobos Avenue between 46th Avenue and the Great Highway
Yes, but: Street safety improvements across 34 locations show on average that pedestrian-vehicle close calls fell 49%, while vehicle collisions with pedestrians dropped by 32%, per the mayor's office.
Some corridors are no longer on the HIN as a result, including:
- California Street between 18th Avenue and Arguello Boulevard, where projects like upgraded crosswalks and lane changes led to a 64% decrease in injury collisions.
- Seventh Street between Harrison and Townsend, where total injury crashes dropped 69% between 2016 and 2024 following additions like a protected bikeway and pedestrian safety zones.
- Townsend Street between Third and Eighth streets, which recorded a 52% decline after the city installed a separated bikeway, pedestrian pathway and transit boarding islands.
Flashback: The 2022 map, which analyzed data from 2017 to 2021, found that 12% of all streets account for 68% of San Francisco's worst crashes.
What's next: San Francisco police will prioritize traffic enforcement in regular patrol activity based on HIN locations within each police district, the mayor's office said.
- SFMTA is also continuing to paint daylighting curbs across the city, target street design changes informed by the 2024 HIN and monitor rollout of its automated speed safety camera program, which led to a 72% decrease in speeding across 15 sample locations after launching last summer.