Why the Treasury yield curve is in focus again

Add Axios as your preferred source to
see more of our stories on Google.
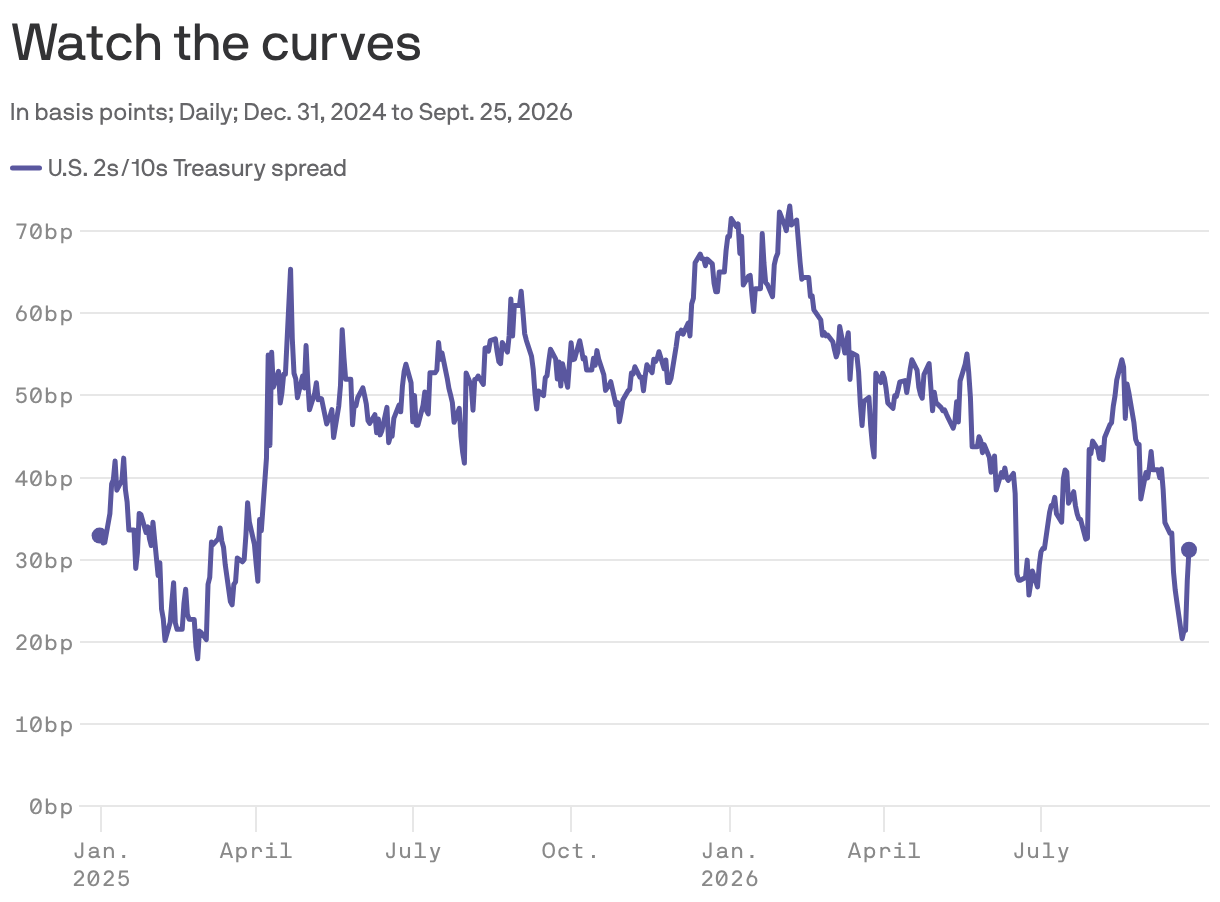
The Treasury yield curve has reentered the financial chat, as investors and traders remain mindful of its strong record of forecasting recessions.
Why it matters: In the past, when certain segments of the yield curve have inverted, or turned negative, it has been one of the most reliable signals that a recession would follow.
Driving the news: Over the last few weeks, the difference between yields on two-year Treasury notes and yields on the 10-year Treasury note tumbled to roughly 0.20 percentage points (20 basis points).
- It has bounced somewhat since then, but the sharp move raised the prospect that this part of the Treasury curve could soon invert.
What they're saying: UBS Global Wealth Management noted Monday that the compression of this 2s/10s spread — as it's known on Wall Street —"raises the possibility that 10-year Treasuries could soon yield less than shorter maturities, creating an inversion that has historically preceded U.S. recessions."
The big picture: There are a few theories about why inversions have front-run recessions in the past. Here's one: Banks borrow at shorter maturities and use that money to make longer-term loans at higher rates — and the yield curve mirrors that spread, which is, effectively, a lender's profit margin.
- The wider that gap is, the bigger the incentive for banks to lend.
- But when the curve shrinks or inverts, the incentive to lend evaporates.
- And since bank credit is vital to economic growth, if bank lending falls, a recession more often than not is in the offing.
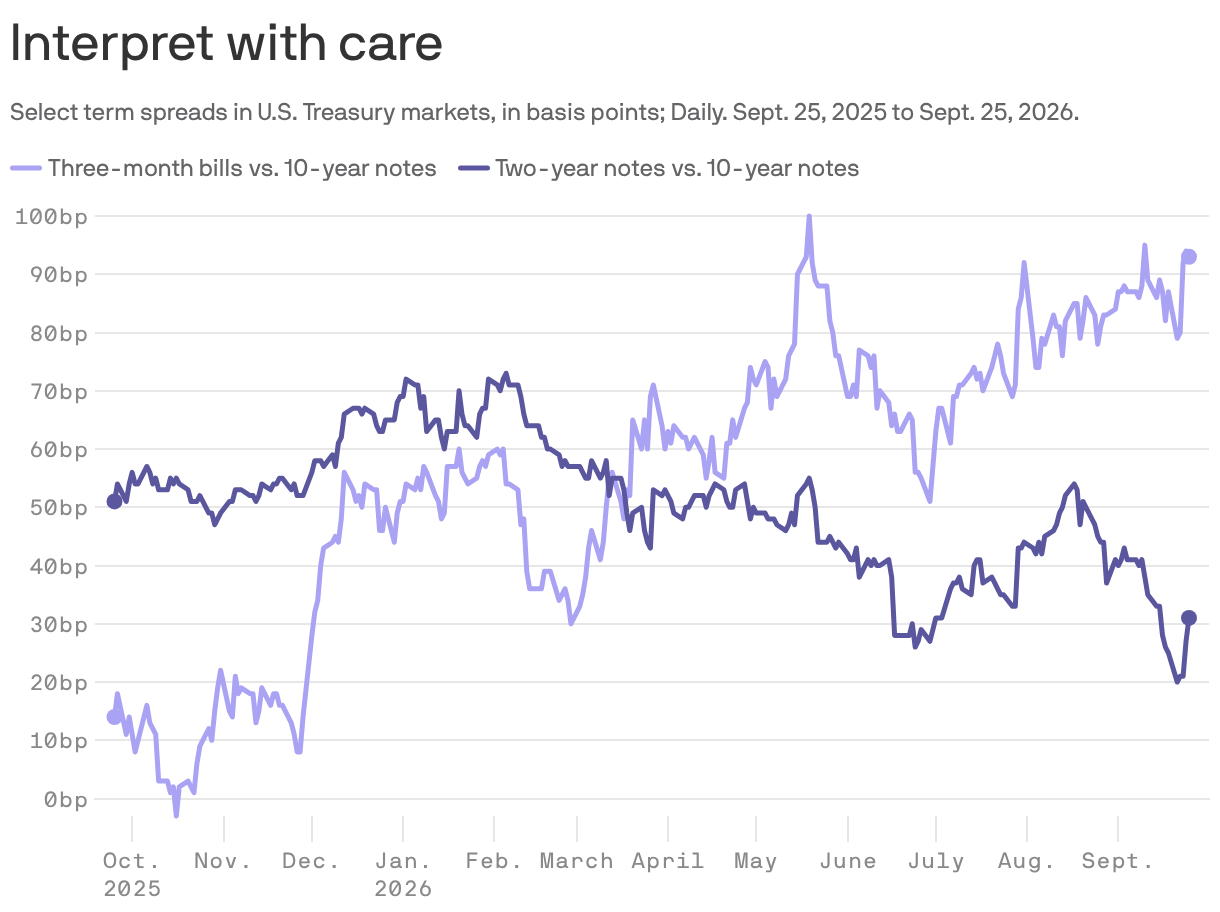
Zoom in: When we talk about the "yield curve," we usually mean the difference — or spread — in yields between Treasury securities of different maturities.
- For instance, the spread between yields on two-year Treasury and 10-year Treasury notes is one of the most closely watched.
- But there's another stretch of the curve that has been even more accurate as a predictor: the spread between three-month Treasury bills and the yield on the 10-year note.
Stunning stat: Between 1969 and 2020, every time this segment of the yield curve inverted — that is, turned negative — a recession followed.
- In all, it correctly called eight straight recessions without a single false positive.
Reality check: The three-month/10-year's streak as an economic Cassandra came to an abrupt end in November 2022, as the Federal Reserve jacked up short-term interest rates to counter the post-COVID inflation.
- The curve remained persistently inverted until 2025.
- Yet, no recession followed.
More importantly, that segment of the curve remains safely in positive territory now.
- Indeed, while the spread between two-year and 10-year notes has been falling, the spread between three-month bills and 10-year notes has been rising, and is now roughly 1 percentage point (100 basis points).
- In other words, the most reliable part of the yield curve when it comes to predicting recessions seems to be getting further away from indicating any risk of an economic downturn.
The bottom line: As we wrote Monday, the signal that bond markets seem to be sending is that the economy is much stronger than many may have been expecting lately.
- As a result, investors are ratcheting up their rate expectations for the next couple years, essentially a bet that the Fed will have to keep the short-term rates it controls higher for longer.
- And that's why the two-year note is up so much, resulting in a sharp decline in the 2s/10s segment of the curve.
