Axios Markets

September 23, 2026


1 big thing: Reasons to worry about stocks. Or not
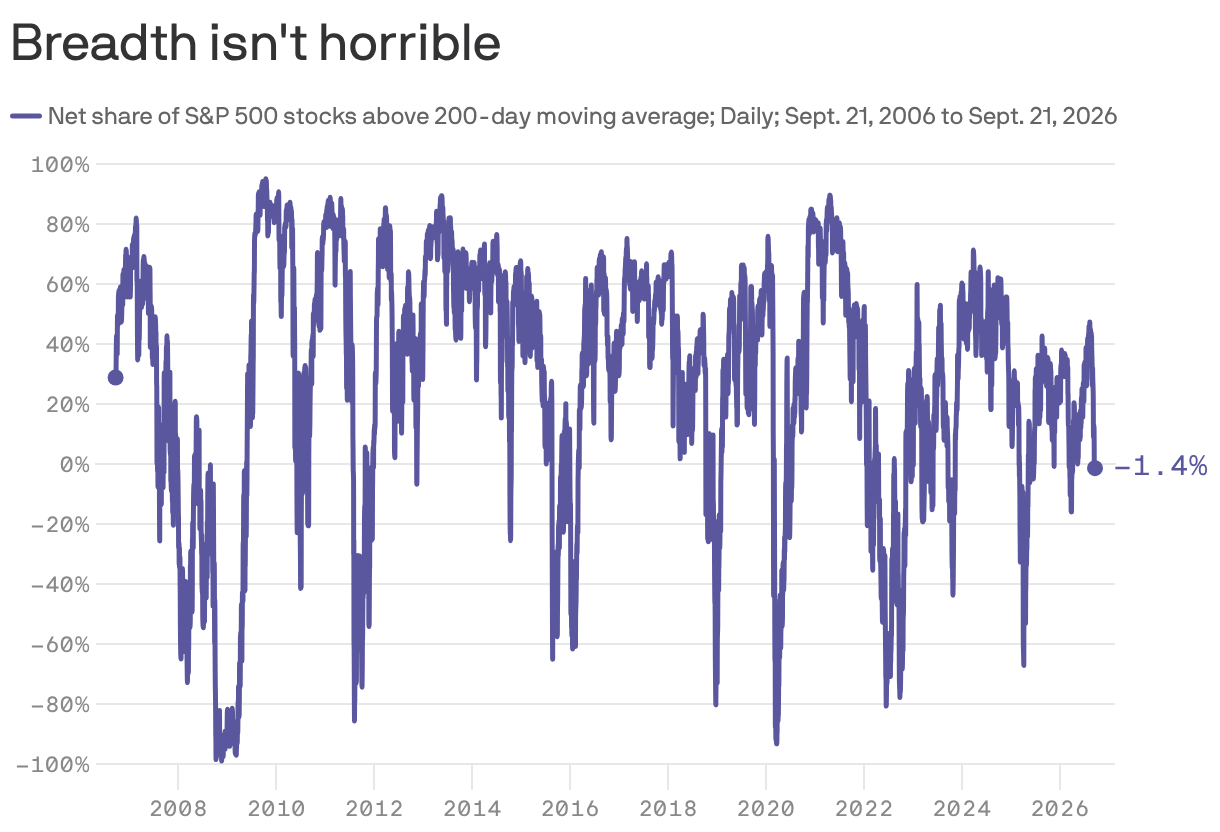
Worries about the underlying strength of the stock market — broadly defined as "market breadth" — are popping up again.
The big picture: Such nervousness comes as the AI-driven rally nears its fourth anniversary next month.
The latest: A post on X from technical analyst Jason Goepfert has recently generated market chatter. He showed that the S&P 500's gain of 1.5% Monday brought it to within 1% of a new all-time high even as the number of its constituents hitting new 52-week lows dwarfed those hitting new 52-week highs.
- Goepfert says the last time the market saw this particular confluence was Dec. 21, 1999 — not long before the dot-com bubble peaked in March 2000.
- The only other previous time was in July 1929, he says.
What they're saying: "We've never in almost 100 years seen breadth this bad," he said in a separate post.
Zoom out: Technical traders and analysts try to divine market signals from changes and patterns in charts rather than sweating the details of sales, profits and economic growth. And they often try to "look under the hood" at the underlying strength of the different stocks that make up indexes like the S&P 500.
Yes, but: There is little solid evidence that a deterioration of "market breadth" has any predictive power when it comes to ringing the alarm about market crashes.
- Goepfert came up with one measure of "market breadth." But there are plenty of others, including the net share of S&P 500 stocks that are above their 200-day moving average, which I've charted above.
- As you can see, it has weakened recently, but it's not at particularly acute levels. It's basically meandering around as it always does.
The other side: Does that mean things are absolutely fine and the market is sure to keep rising? Of course not. I have no idea. Nobody does.
- That said, there are some other indicators that academic research has shown to have at least a bit of predictive power as market harbingers.
Zoom in: These indicators include:
- A major boom in bond market borrowing — check. Bond market activity has surged as hyperscalers and the companies they're backstopping borrow big to build AI data centers.
- A boom in the issuance of new shares of stock — check. Equity issuance exploded earlier this year, with the SpaceX IPO and share sales by market giants like Alphabet.
- Extreme valuations — well, maybe. It depends what measure you're using. The so-called Cyclically Adjusted Price-to-Earnings ratio — which normalizes earnings over the previous decade — is at nosebleed levels. (But it has also been at nosebleed levels for most of the last decade.) On the other hand, the plain vanilla forward price-to-earnings ratio for the S&P doesn't look too egregious at under 20, at least not by recent standards. At the same time, price-to-sales ratios are off-the-charts high and at extreme levels not even seen during the dot-com bubble. So, take your pick.
Between the lines: While we don't put much faith in the predictive powers of technical analysis — also known as astrology for men — it can be interesting to note when market movements generate attention as "red flags."
- Back in the early 2010s, the so-called Hindenburg Omen was supposedly a signal to sell everything. (Spoiler: It wasn't. The market did tremendously well for years after.)
The bottom line: Maybe that's the lesson. Perhaps sensitivity to such headlines shows how nervous investors are when looking at a bull market that seems to defy gravity.
- But is that a bad thing, suggesting they're on the verge of dumping shares at the next sign of a blaring red headline?
- Or is it a good thing, suggesting that there is still enough worry out there to provide the proverbial "wall" stocks supposedly love to climb?
- Again, take your pick.

3. Charted: Top U.S. diesel importers


A ban on U.S. diesel fuel exports would likely backfire, say some economists, energy market experts and those in the industry.
Where it stands: U.S. refineries currently produce more diesel than the country needs. Exports surged this year after the wars in Iran and Russia knocked out key refineries.
By the numbers: The U.S. already has enough diesel. The country uses roughly 3.6 million barrels per day, and 1.7 million get exported, per an analysis of Energy Information Administration data by RSM chief economist Joe Brusuelas.
- Mexico, the Netherlands, Chile and the U.K. are the top importers of U.S. diesel.
How it works: If U.S. refiners can't export that surplus, that would produce a glut in the market and prices would come down at first, Brusuelas says.
- But after that, it's likely that refiners would respond to less demand in the market by producing less diesel — they'd no longer have the incentive of fetching higher prices outside the country and would likely cut production.
Zoom out: "An export ban would shove that diesel back into a domestic market that's already well supplied, risking refinery run cuts, while doing nothing about the global shortage that is actually the mechanism leading diesel prices to record levels," says Patrick De Haan, head of petroleum analysis at GasBuddy.
- The U.S. accounts for about 18% of global diesel exports. Taking that much supply off the market would send global prices higher — costs that would ultimately feed back into the U.S. through imported goods, Brusuelas says.
Axios Markets