How San Francisco's racial demographics have changed since 2000


Add Axios as your preferred source to
see more of our stories on Google.
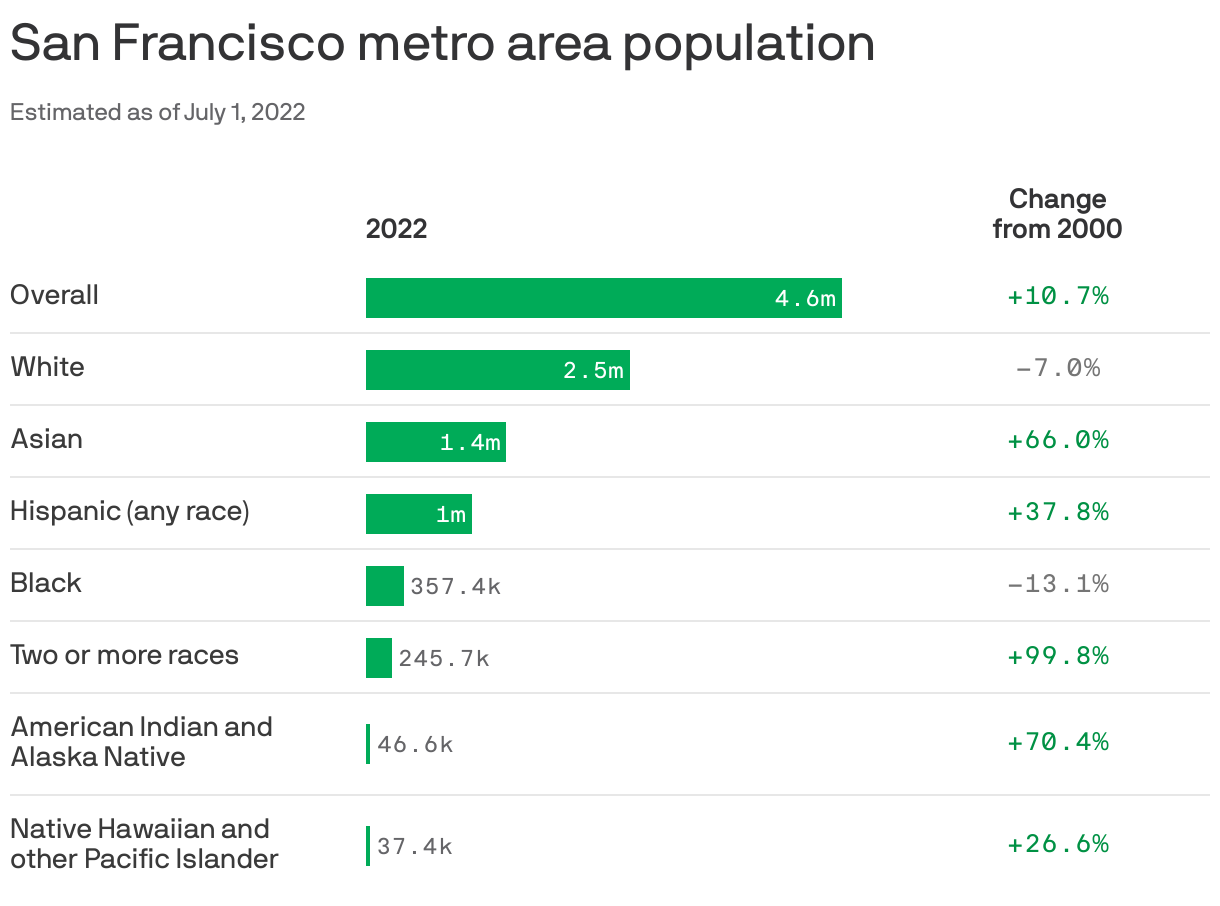
San Francisco's metro area population experienced a 10.7% increase from 2000 to 2022, but that trend wasn’t evenly distributed across all racial groups, per a new Axios analysis of U.S. Census Bureau data.
Why it matters: Such demographic data is a vital snapshot of how the racial and ethnic makeup of the U.S. is changing over time and can inform policies and programs nationwide.
Driving the news: From 2000 to 2022, San Francisco recorded spikes in mixed-race people, American Indians and Alaska Natives, Asians, Hispanics or Latinos and Native Hawaiians and other Pacific Islanders.
- Meanwhile, the share of Black people fell 13.1%. The number of white people also saw a decline, though to a lesser degree.
Our thought bubble: San Francisco's diminishing Black population is a symptom of larger issues, including the rising cost of housing, discriminatory housing practices, health disparities, the destruction of primarily Black neighborhoods and gentrification.
- The city’s Black population has the lowest median income household and the highest mortality rate for nine of the top 10 causes of death, a 2020 San Francisco Human Rights Commission report found.
Context: Of the over 808,000 people in San Francisco city today…
- 39.2% are white.
- 34.4% are Asian.
- 15.4% are Hispanic or Latino.
- 8.4% are mixed-race.
- 5.2% are Black.
- 0.5% are American Indian and Alaska Native.
- 0.4% are Native Hawaiian and other Pacific Islander.
Don’t forget: San Francisco also lost a staggering 7.1% of its residents between 2020 and 2022 — a decline that was likely at least partially fueled by the remote work era combined with still-climbing housing costs.
Zoom out: Nationally, the country's Pacific Islander, Asian and Hispanic or Latino populations saw the biggest percentage increases between 2000 and 2022.
- The number of Native Hawaiian/Pacific Islanders grew about 120%, to nearly 879,000.
- The Asian population grew about 105%, to 21 million.
- The Hispanic or Latino population grew about 80%, to nearly 64 million.
- The Black population grew 31%, to 45.4 million.
The big picture: Demographic trends are driven by varied factors, including birth, mortality and immigration rates among different socioeconomic groups.
- The U.S. is still predominantly white. America’s white population saw a 19% growth between 2000 and 2022 to nearly 252 million.
The country is also rapidly aging, Axios' Emily Peck recently reported with the median age reaching a record 38.9 last year.
Of note: The share of people who say they're "extremely proud" to be an American has been falling for years — and a record high 50% of Americans now view the state of morality in the U.S. as "poor," according to new Gallup data.