Jun 21, 2024 - News
San Diego's stripes paint a vivid picture of climate change

Add Axios as your preferred source to
see more of our stories on Google.
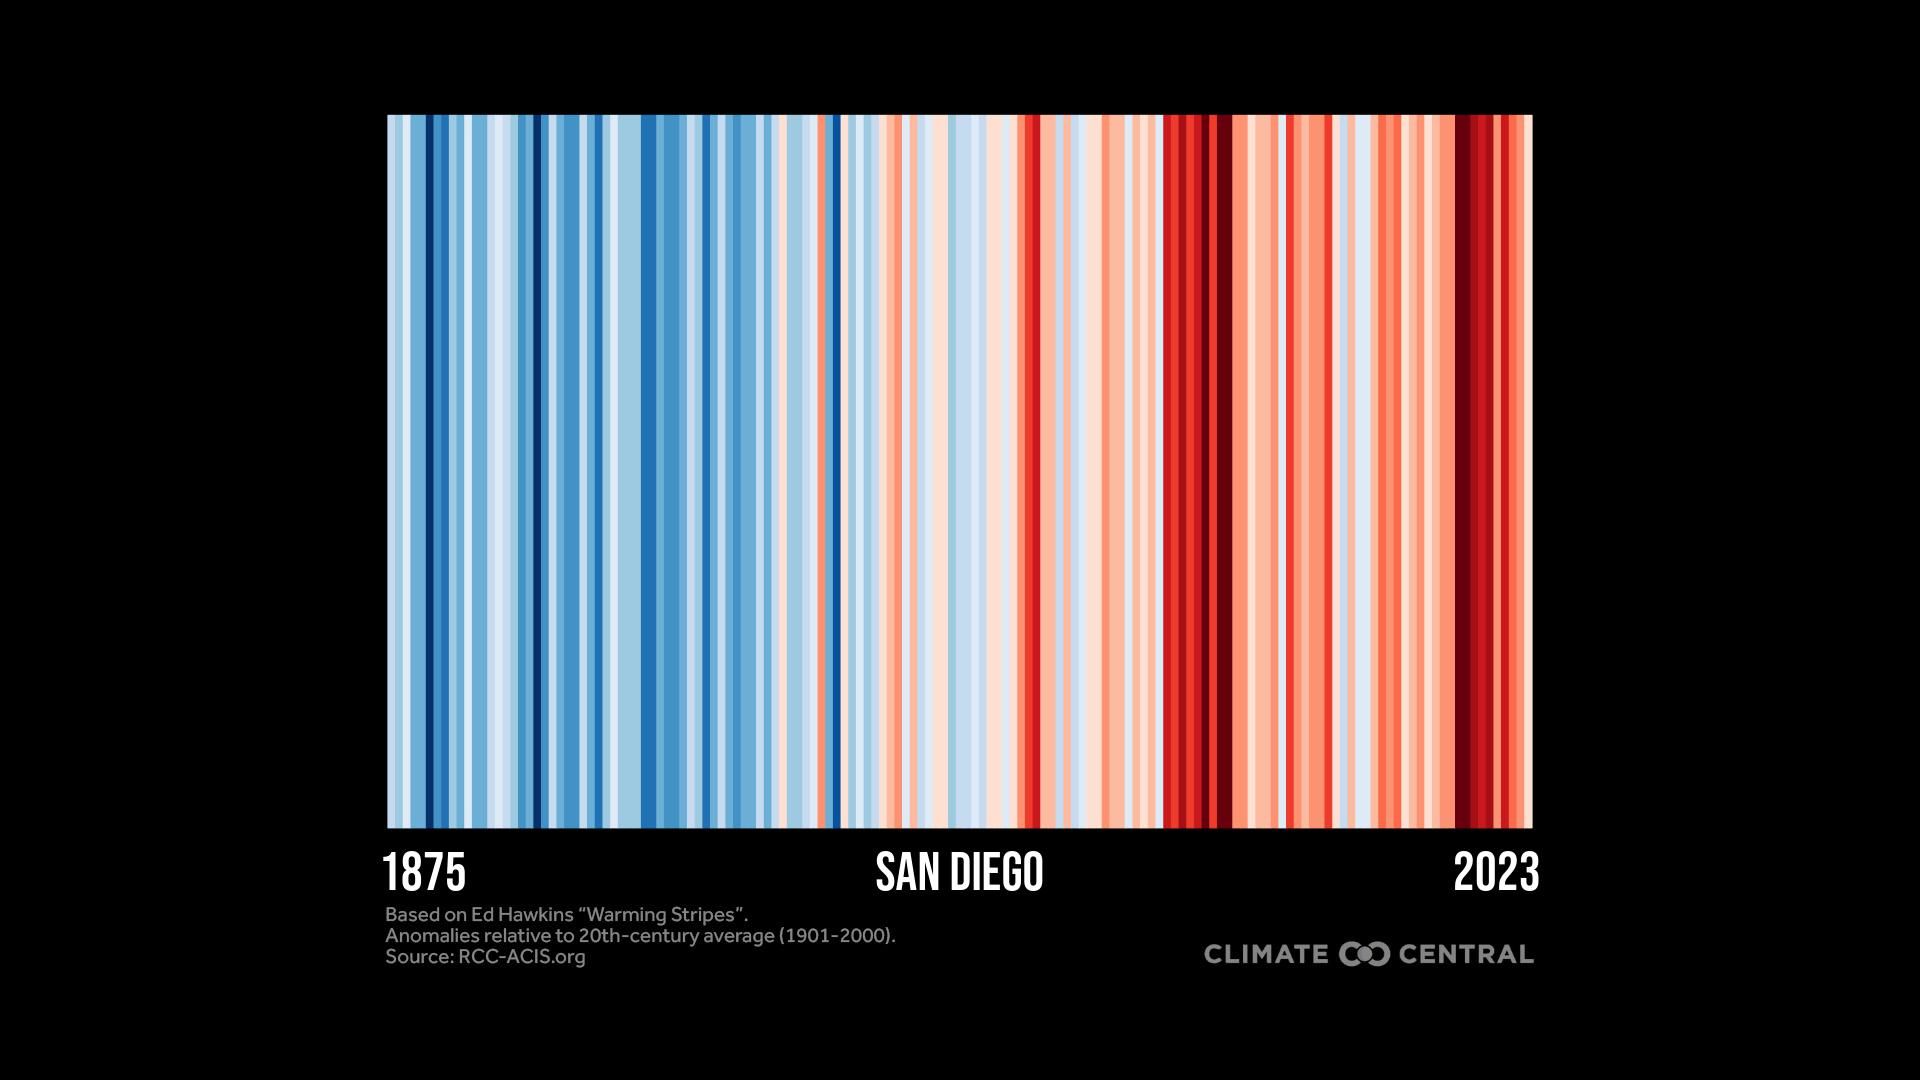
San Diego's annual temperatures from 1875 to 2023, relative to the 1901 to 2000 average, with colder years in blue and warmer years in red. Data source: RCC-ACIS.org