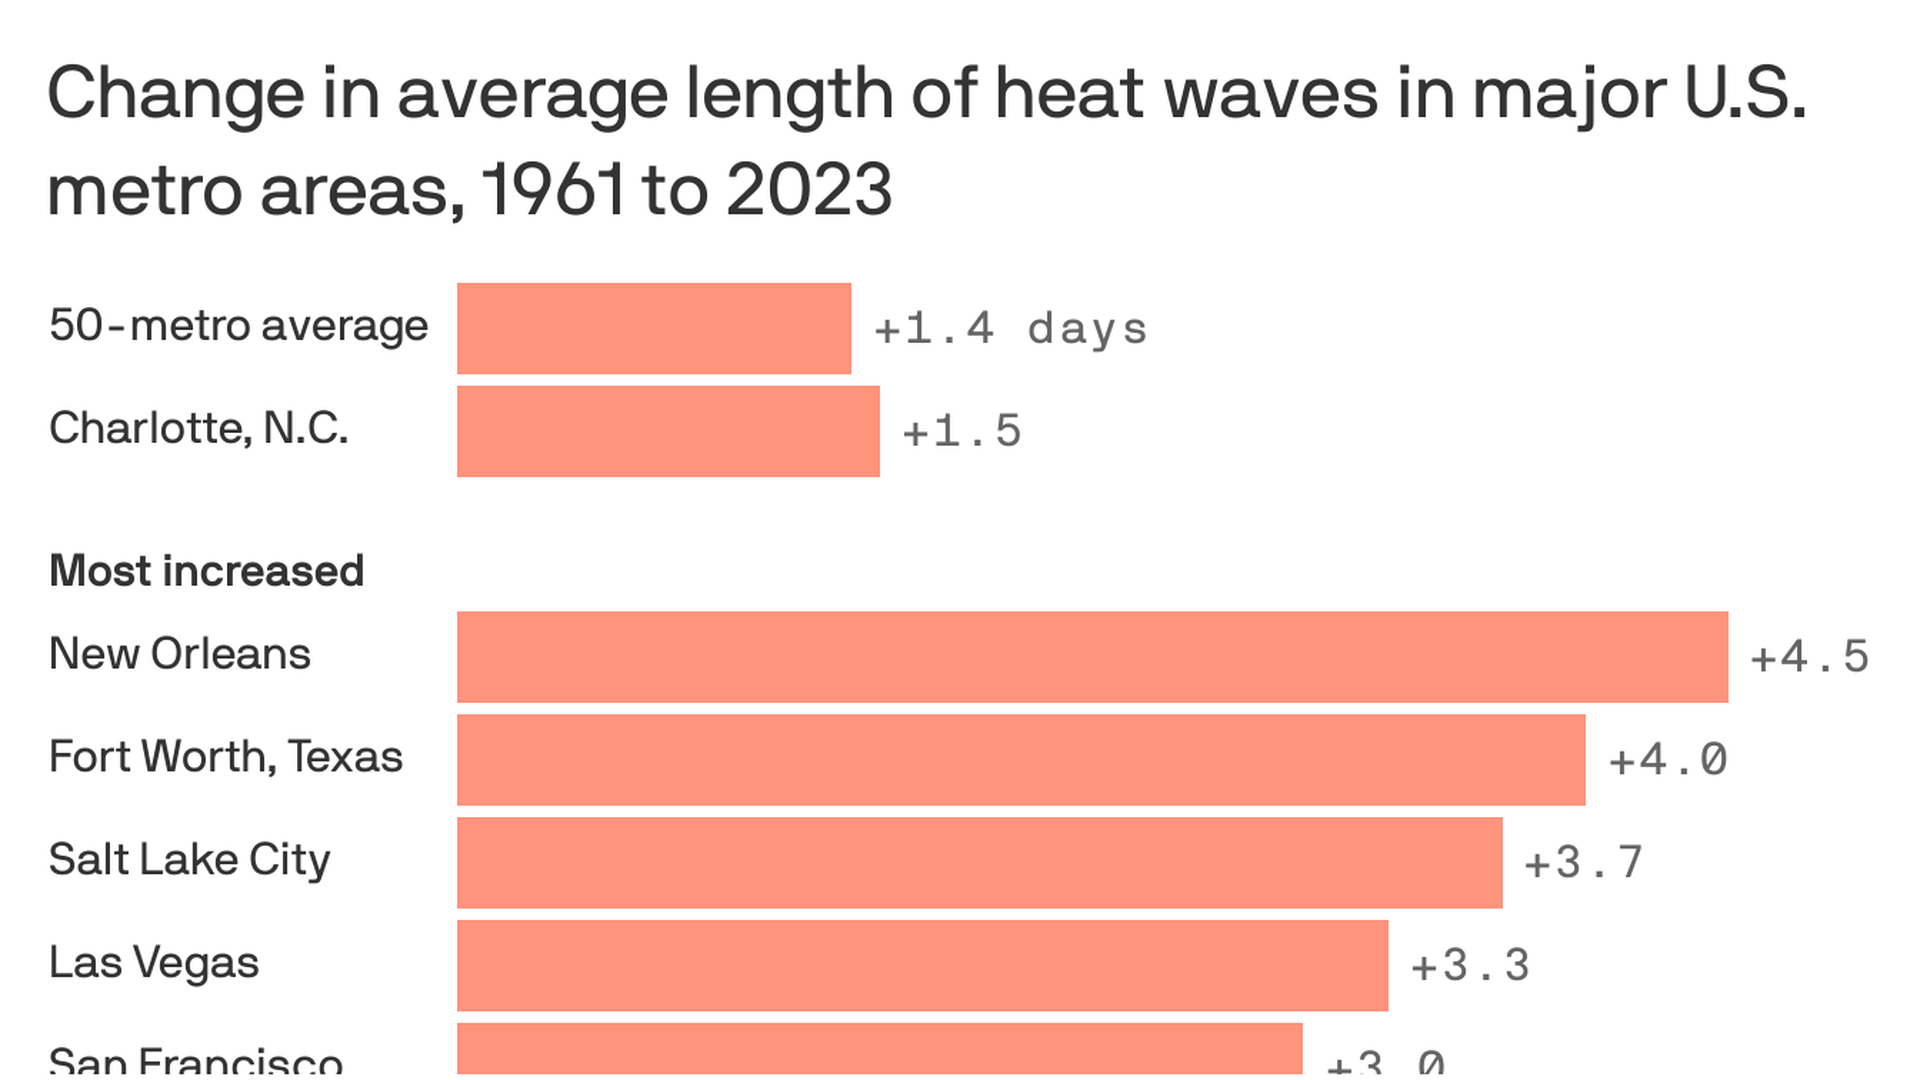
Data: EPA; Note: Includes 50 most populated metros; New York City, Houston, Minneapolis-St. Paul and Denver were excluded for incomplete data in this period; Chart: Axios Visuals
Heat waves in Charlotte, and across the country, are becoming longer, more intense and more frequent, new EPA data shows.
By the numbers: Charlotte's average heat wave increased 1.5 days between 1961 to 2023. The average metro area saw a 1.4-day increase.
Zoom out: Raleigh saw a 2.1-day increase and New Orleans saw more than any other metro in the country at 4.5 days.