Austin heat waves last longer


Add Axios as your preferred source to
see more of our stories on Google.
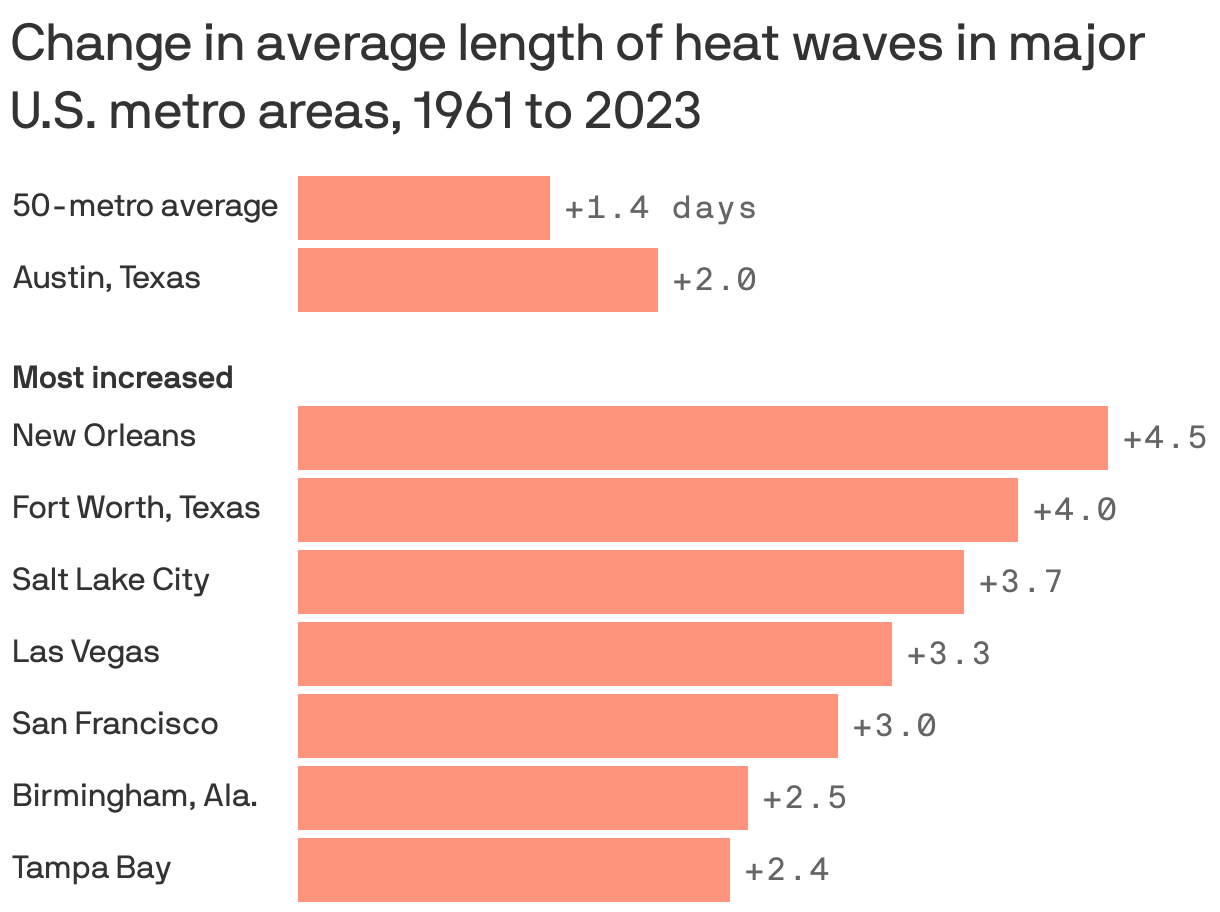
New data shows the upward march of heat waves in the U.S.
The big picture: The EPA info, part of a wider new report on climate metrics, shows heat trends in the 50 largest U.S. metro areas.
- Heat waves are becoming longer, more frequent and more intense.
Zoom in: Often defined as "a persistent period of unusually hot days," our Austin heat waves last two more days, on average, than in the 1960s.
How it works: EPA tracked events of two or more consecutive days when daily, humidity-adjusted temps topped the 85th percentile of historical July-August temps in 1981-2010.
The bottom line: "Heat waves are more than just uncomfortable," the EPA authors write, "they can lead to illness and death," as well as damaging crops and increasing wildlife risk.
- "Unusually hot days and heat wave events are a natural part of day-to-day variation in weather. As the Earth's climate warms, however, hotter-than-usual days and nights are becoming more common," they observe.