The fund managers are stock-maxxing

Add Axios as your preferred source to
see more of our stories on Google.
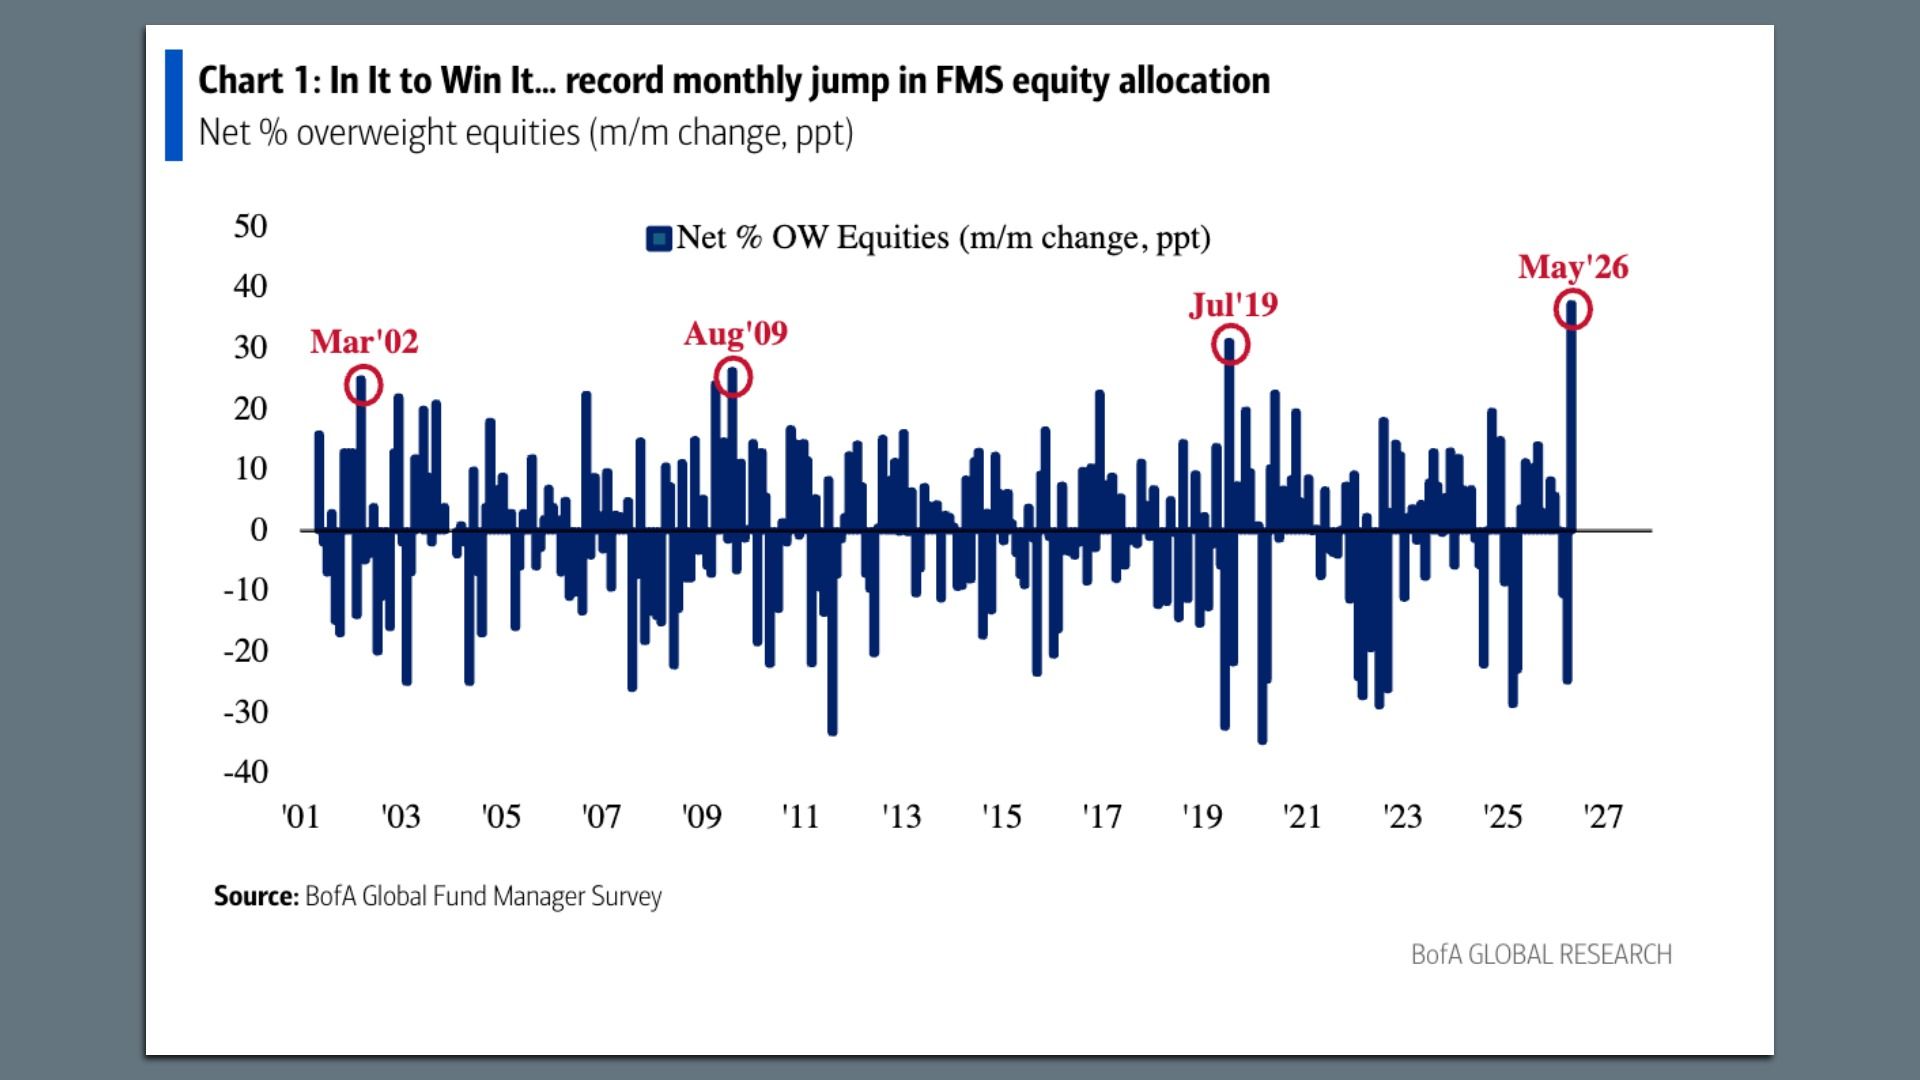
BofA Global Fund Manager Survey
Investors went on a stock-buying binge earlier this month, even as inflation worries increased, finds the latest release of Bank of America's influential global fund managers' survey.
Why it matters: The outsize optimism helps explain the run-up in stock prices over the past few weeks.
How it works: BofA surveyed 200 investors, including chief investment officers, strategists and portfolio managers, with $517 billion in assets under management from May 8-May 14.
- They manage money at institutional funds, hedge funds, prop desks, etc.
Where it stands: Fund managers' allocation to equities jumped to 50% overweight, meaning that they're holding more stocks than their standard benchmark, from 13% in the previous month.
- It was the steepest month-over-month jump since 2001.
- It's also the highest stock allocation the survey has tracked since January 2022 — right before stocks started falling in the wake of rising inflation and energy prices stemming from the Ukraine-Russia war.
Zoom in: Speaking of a rosy outlook, more than half of global fund managers believe the Strait of Hormuz will reopen by June.
- Global investor sentiment overall is at its highest level since February — but still below where it was after Trump's tax cuts passed Congress last year.
Yes, but: 40% said inflation is the No. 1 tail risk, up from 26% last month.
What to watch: These folks may be unprepared if the stock rocket ship falls back to Earth.
- Both the S&P 500 and Nasdaq have declined over the past three trading sessions, after weeks of hitting new highs — as rising bond yields continue to pressure stocks.
