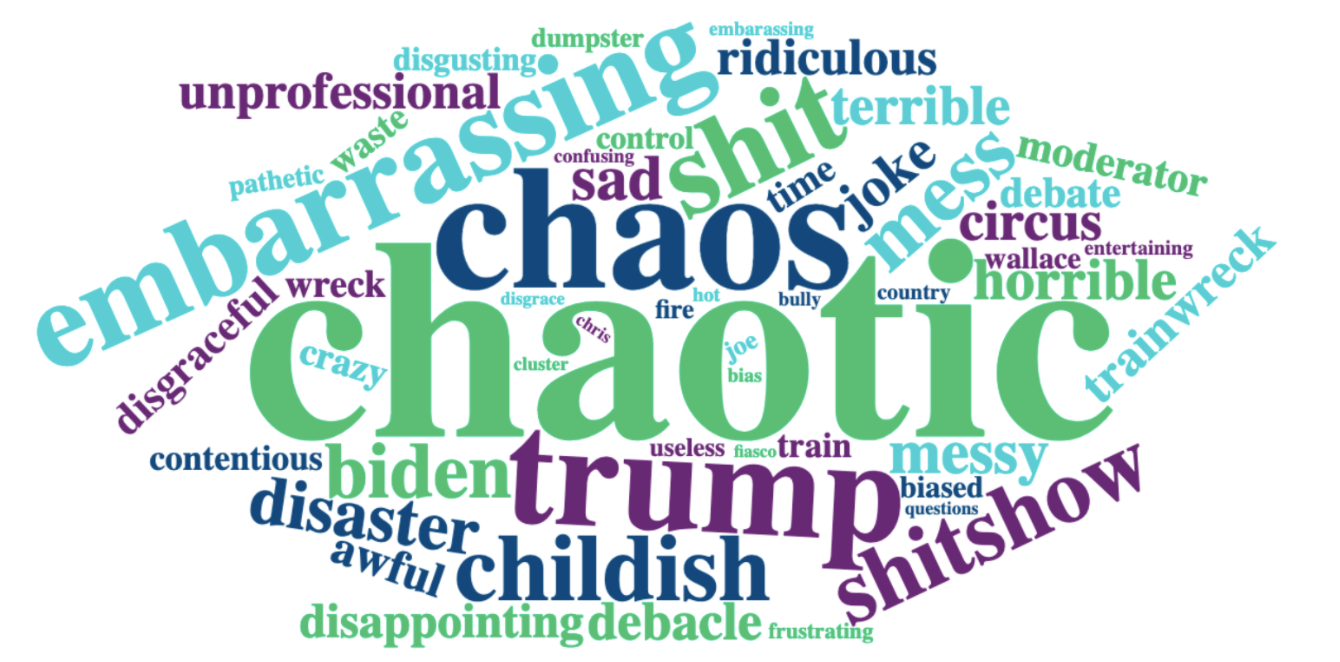
SurveyMonkey poll: Disappointment, anger, four-letter words

Add Axios as your preferred source to
see more of our stories on Google.
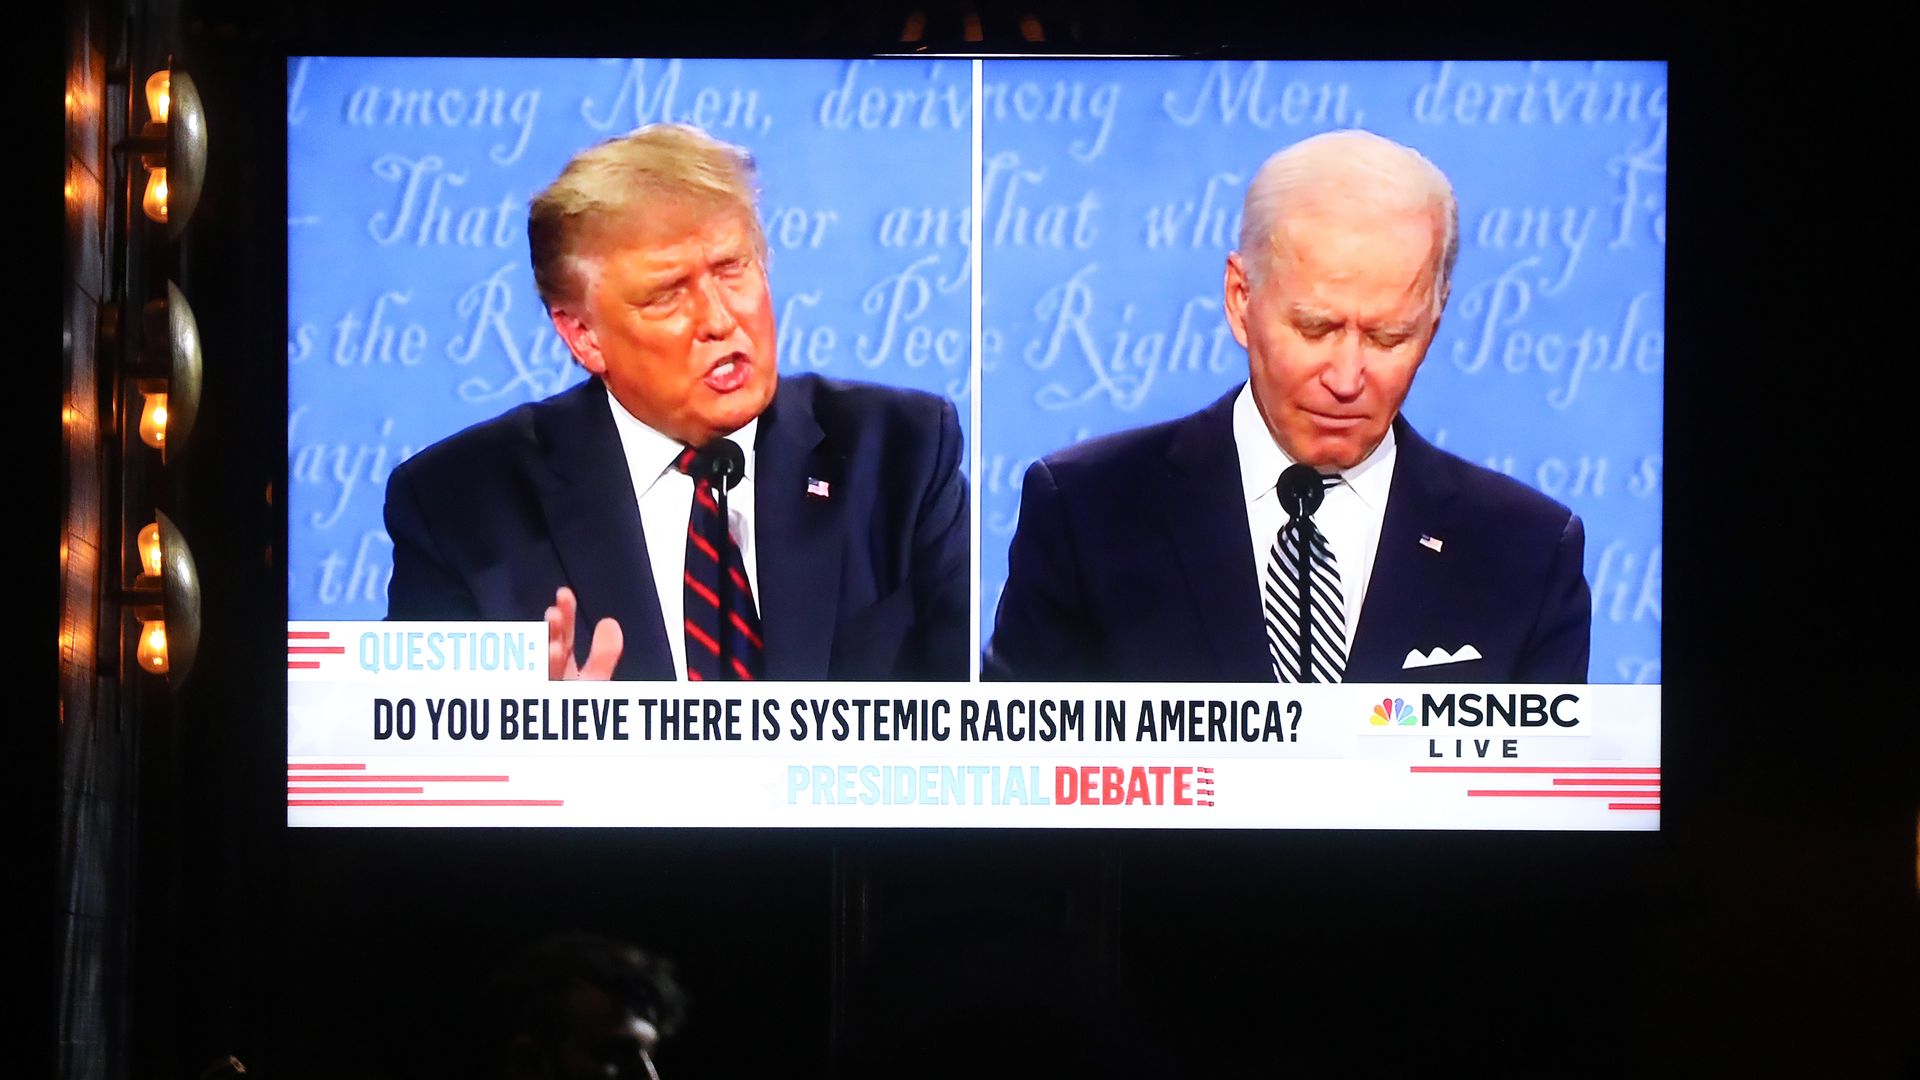
Photo: Mario Tama/Getty Images
Three words Americans associated most with President Trump's debate performance: Bully, childish and rude. Joe Biden: Weak, presidential and poor. The debate itself: Chaotic, Trump and variations on the word s--t.
The big picture: A new Axios-SurveyMonkey poll shows that while nobody on that stage should feel great about their performance, Trump hurt himself more than his rival with Tuesday night's theatrics in what's been called the worst U.S. presidential debate in history.
- The debate yielded outsized disappointment from independents and Trump's fellow Republicans, the survey found, while Democrats walked away the angriest, two outcomes that could benefit Biden.
By the numbers: Three times as many voters said President Trump did worse than they expected in the debate — 39% compared with 13% for Biden.
- A majority of Republicans (57%) and independents (61%) said their primary reaction was disappointment.
- 37% of Democrats said they walked away angry, compared with 24% of independents and just 9% of Republicans.
Between the lines: Biden may have to lean into that anger to propel his backers to the polls. Only 5% of Democrats said they were primarily excited after the debate, compared with 18% of Republicans.
Why it matters: To the extent that it does, it's more likely to impact turnout than to change preferences.
- More than 9 in 10 people who say they'd already decided on Trump or Biden planned to stick with their choice.
- One group that's still up for grabs is one in 10 respondents who said they don't plan to vote. Two-thirds of them said they could still change their minds. But historically this has been a difficult group to motivate.
The bottom line: Given the alternative, it's better to come out of the debate on the prevailing side of anger than on the losing side of disappointment.
Methodology: This SurveyMonkey online poll was conducted September 29-30, 2020 among a national sample of 2,618 adults in the U.S.
- Respondents for this survey were selected from the more than 2 million people who take surveys on the SurveyMonkey platform each day.
- The modeled error estimate for this survey is +/- 2.0 percentage points. Data have been weighted for age, race, sex, education, and geography using the Census Bureau’s American Community Survey to reflect the demographic composition of the United States age 18 and over.
