More people driving in D.C. area than pre-pandemic


Add Axios as your preferred source to
see more of our stories on Google.
Nature is healing — remember the meme from the pandemic days, when carbon emissions dropped and wildlife caught a breather? Well, new data shows traffic is now higher than pre-COVID.
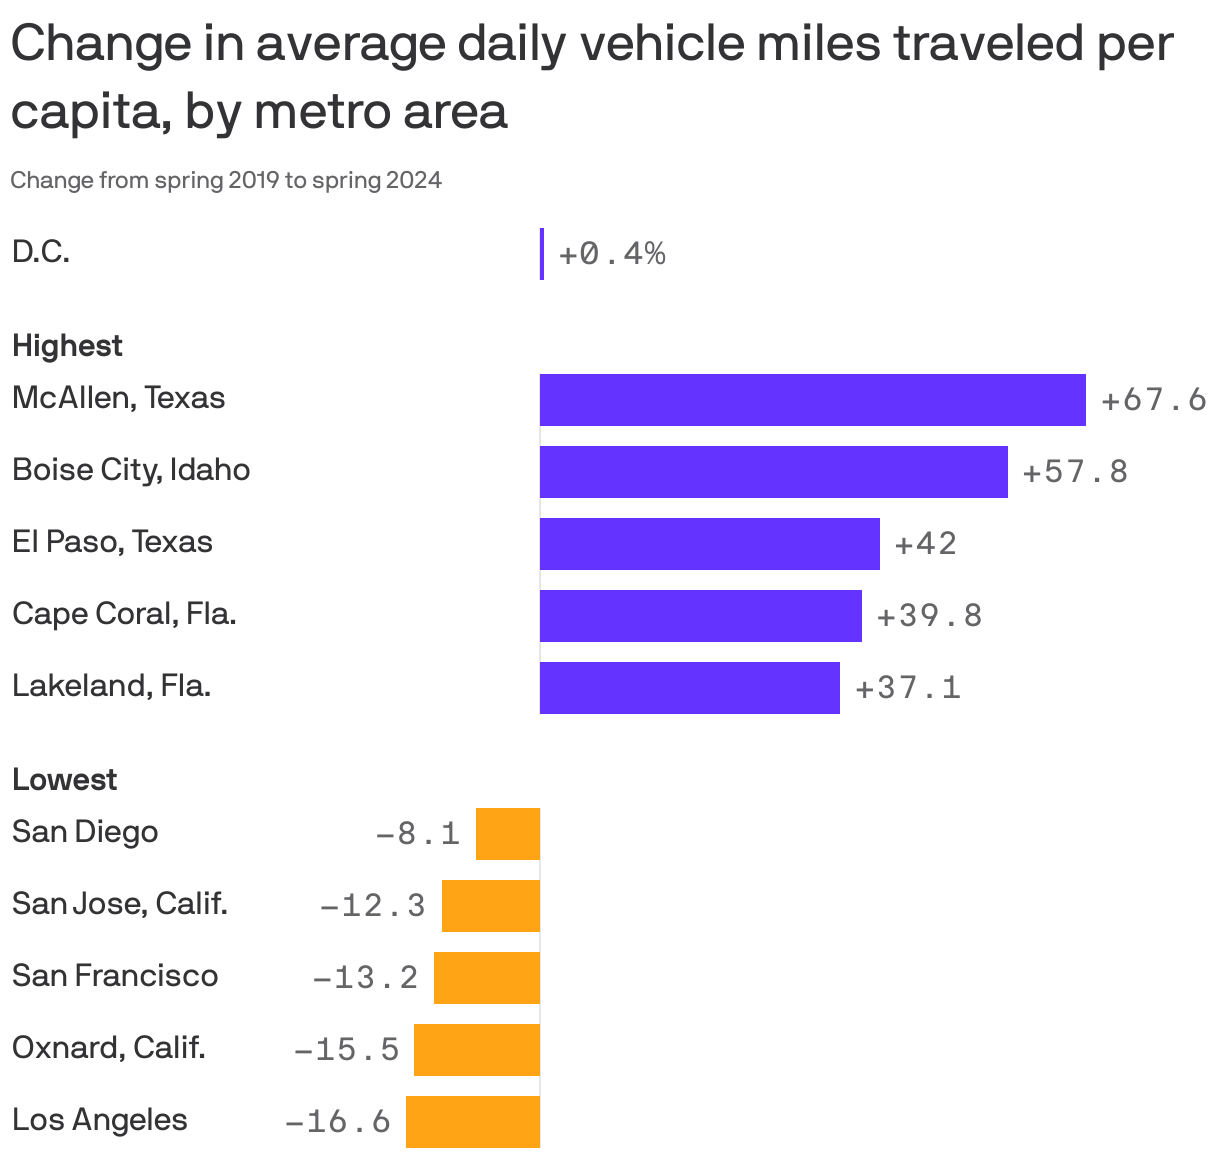
The big picture: Average daily vehicle miles traveled (VMT) per capita increased 12.3% across the 100 biggest U.S. metro areas last spring compared to the same period in 2019, according to a new report from StreetLight Data, a transportation analytics firm.
State of our streets: In the D.C. area, traffic is up less — just 0.4%.
- Yet anyone who goes into the heart of the city knows rush hour feels like it's back with a vengeance. Another data cruncher, the transportation analytics firm INRIX, found that congestion delays downtown are up 20% from 2022.
- Earlier this year, D.C. instituted "Clear Lanes" on red-painted bus lanes. The initiative puts traffic enforcement cameras on Metrobus windshields to fine illegally parked vehicles. (Plenty of the tickets have gone unpaid.)
Yes, but: Our traffic situation isn't as bad as New York's, where "vehicle miles traveled" are up 14% in the metro area, per StreetLight Data.
Between the lines: While higher VMT tends to mean more car-related emissions, it can also be a sign of changes generally perceived as positive, like more economic activity.
- Lower VMT can be a sign of successful public transit or cycling projects — or an indication that lots of people are still working hybrid or remotely.
- The metros with the biggest reductions in VMT per capita are concentrated in California, like Los Angeles (-16.6%), San Francisco (-13.2%) and San Jose (-12.3%).
Zoom out: "GDP now stands above 2019 levels even in the metros where VMT is still down," per StreetLight's report.
- "This is a signal that GDP growth can be decoupled from VMT growth."