
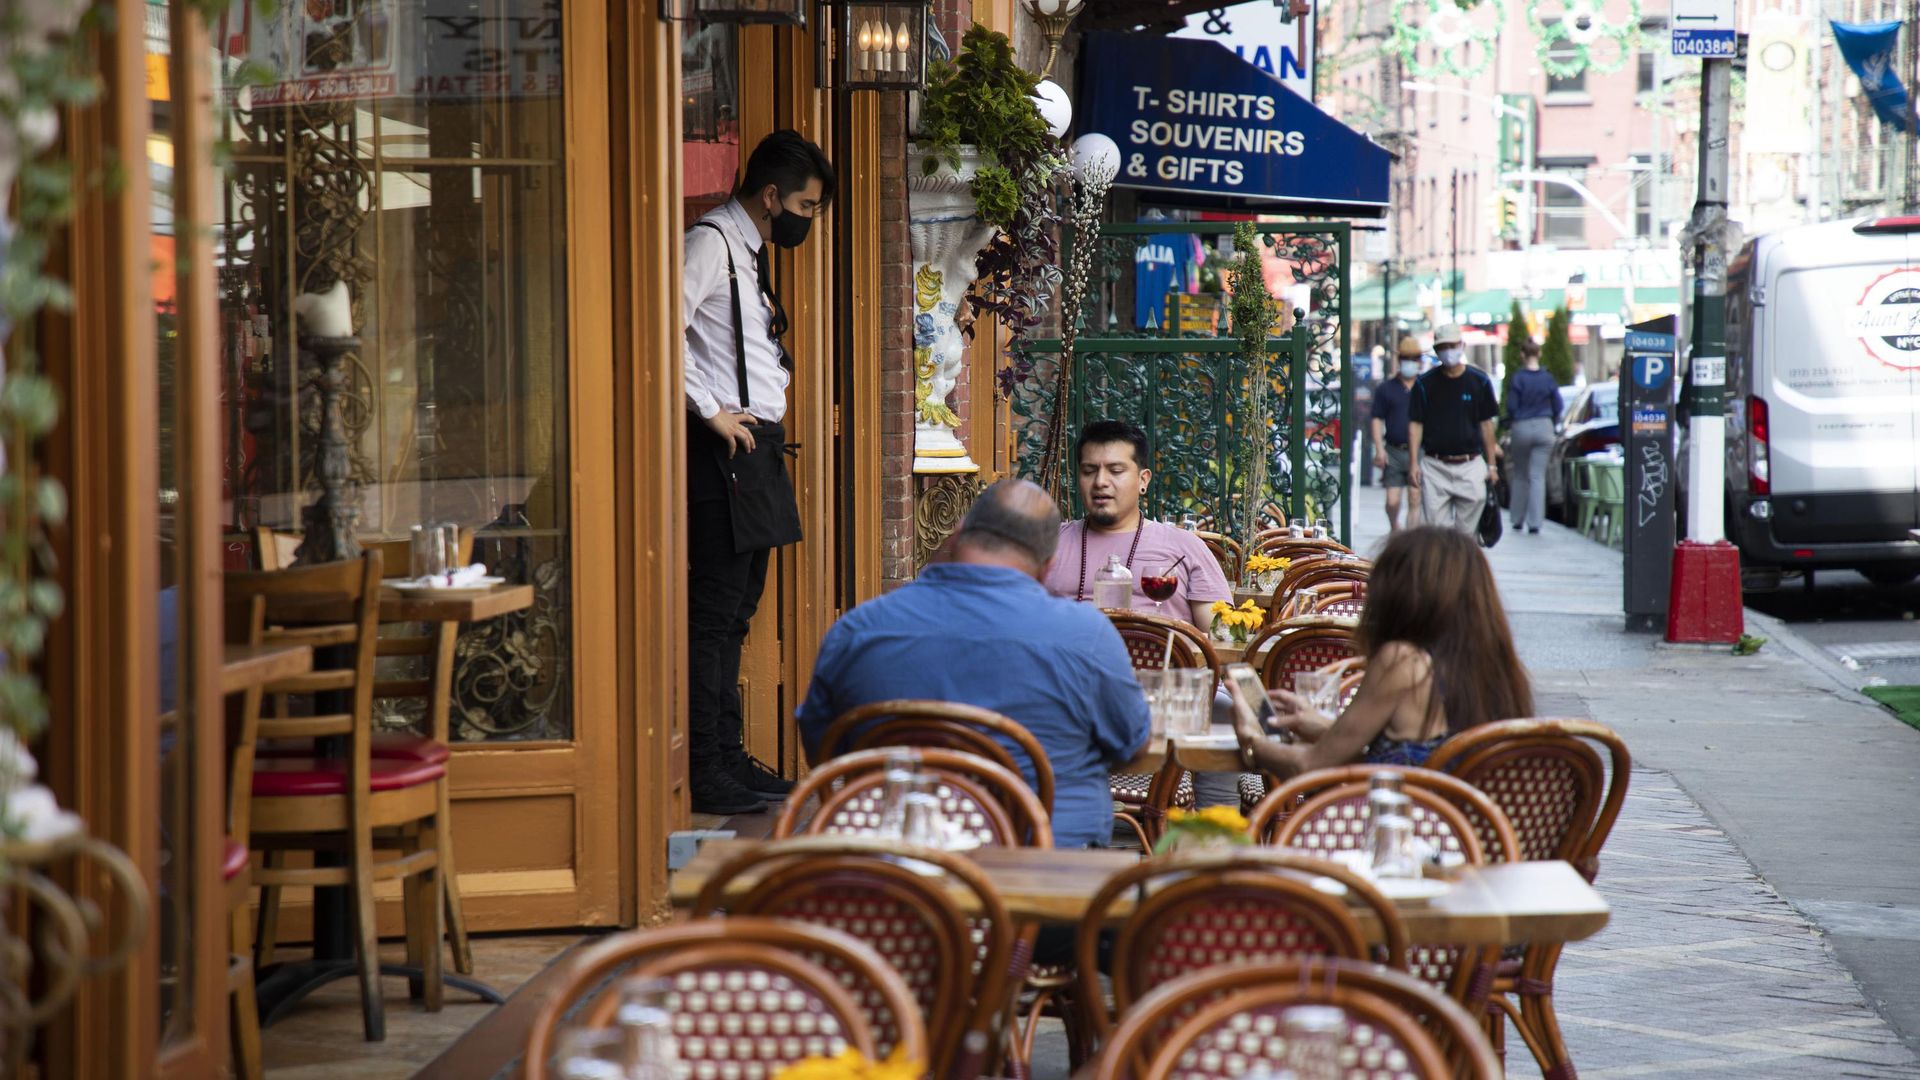
People eat at the outdoor dining area of a restaurant in New York City. Photo: Wang Ying/Xinhua via Getty Images
Given the reporting lag for most traditional economic indicators, investors have turned to real-time data to assess the U.S. economy. Almost all of which shows business activity stalling or declining.
What's happening: Economists at Jefferies write in a note to clients that their in-house economic activity index has "flat-lined" and "has now been moving sideways for the past three weeks."
- "The loss of momentum is broad-based, spanning small business activity, discretionary footfall, restaurant bookings, traffic congestion, and web traffic to state unemployment portals."
- "Regional data show particular weakness in virus-hit states, where V-shaped recoveries are morphing into Ws."
- "Given the timing of the hit, official June data are likely to be spared, but there is clear downside for July data."
The big picture: The coronavirus pandemic appears to be worsening in larger portions of the country, Goldman Sachs economists write in a note to clients.
- States with more than half the U.S. population now meet just one or none of the CDC-recommended gating criteria for reopening — established benchmarks, such as 14 days of fewer COVID-19 cases and fewer people with symptoms.
- CDC guidelines propose the use of six gating indicators to assess when municipalities should move from one phase to another.
Yes, but: The increased detection of these COVID-19 cases lowers the probability and severity of any second wave of infections, researchers at Bank of America note.
- University of Washington's IHME model estimates daily new infections peaked at 243,000 on March 23, but there were so few test kits available that only 8% were detected, according to BofA.
- Currently the IHME model suggests there are about 69,000 new daily COVID-19 infections in the United States.
- "Because testing is becoming increasingly plentiful and sophisticated ... more than half those daily infections are now being detected."