Axios Macro

December 10, 2025


Do strong returns on bonds signal national greatness, as the Treasury secretary has taken to arguing? Not necessarily, if you look at the historical record.
- We have some fun with asset class returns below. Plus, new evidence of a K-shaped consumer economy.
🏦 Situational awareness: It's Fed day! The Federal Reserve is expected to announce an interest rate decision — likely a cut — alongside new economic projections at 2pm ET.
- Fed chair Jerome Powell will host a news conference 30 minutes later; Neil will be in the room. Follow our coverage on Axios.com.
Today's newsletter, edited by Ben Berkowitz and copy edited by Katie Lewis, is 846 words, a 3-minute read.
1 big thing: Bond returns ≠ the economy
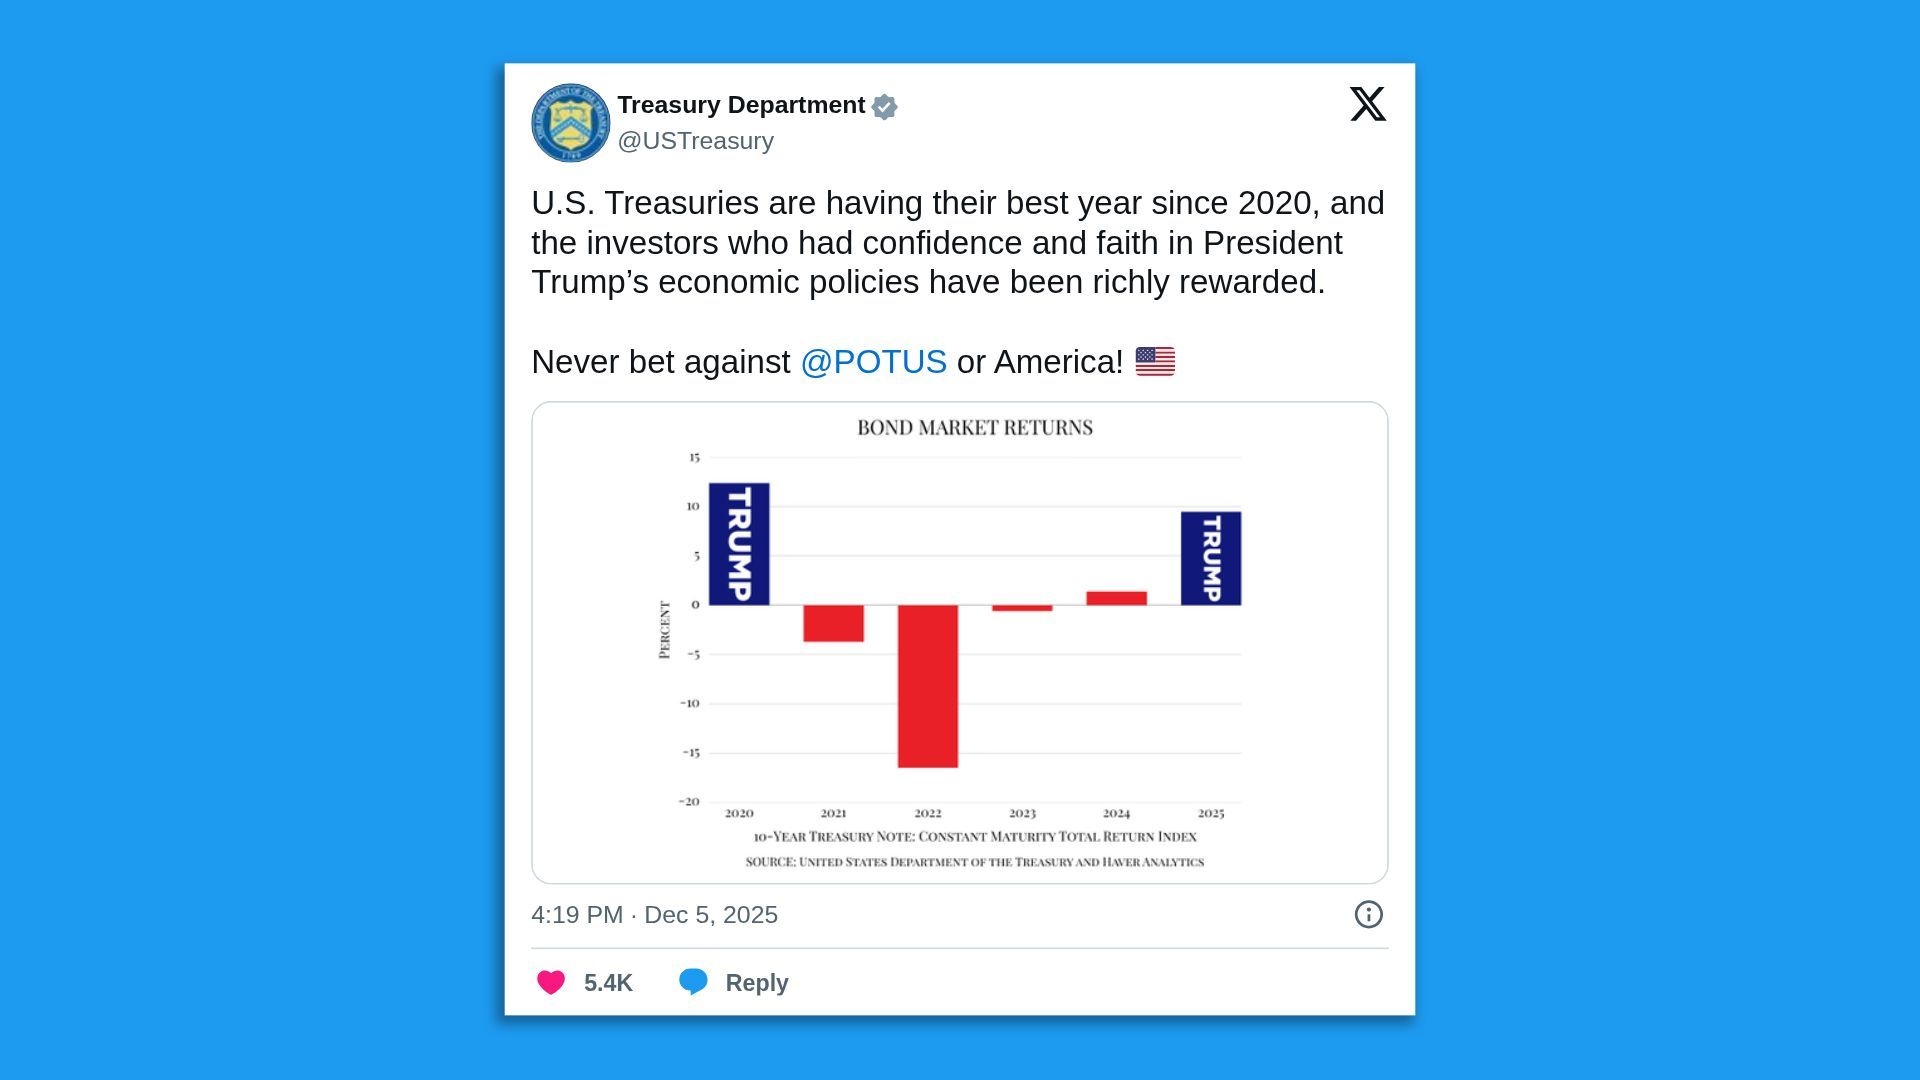
Treasury Secretary Scott Bessent has a message for America: Investors in U.S. Treasury bonds have enjoyed a strong year of returns, and this is a reflection of American economic strength.
The big picture: Bessent's description of this year's returns on Treasury securities is accurate, but bond returns don't necessarily correlate with overall economic conditions.
- Frequently, bonds display inverse correlation with the economy as a whole, rallying when times are bad and losing ground when times are good.
What they're saying: "The bond market had its best year since 2020, and if I have anything to say about it as your top bond salesman, bonds will have another strong year in 2026 as we fight to bring Treasury borrowing costs down," Bessent said at a rally with President Trump in Pennsylvania last night.
- It was no mere offhand remark; Bessent has emphasized bond returns in social media posts and a Sunday TV appearance as well.
Zoom in: Treasuries have returned 5.4% so far in 2025, per the Morningstar U.S. 10+ year Treasury bond total return index. That is, indeed, the highest since 2020.
- Those returns — like any year's returns on bonds — reflect two factors: the interest earnings bondholders receive and can reinvest, and a move in rates that changes the value of existing bonds.
- The 10-year Treasury yielded 4.57% a the end of 2024, for example, so anyone who bought a security then has enjoyed both interest earnings and appreciation in the bond, due to the prevailing 10-year rate falling to 4.17% as of this morning.
- Bessent has emphasized that — contra much commentary in the spring when the trade war flared — this reflects global investor appetite for U.S. assets.
Yes, but: Often the biggest drivers of bond returns are changing expectations about growth and inflation — and those tend to negatively correlate with broader measures of well-being. (Historical numbers here are from New York University finance professor Aswath Damodaran's invaluable database of asset class returns.)
- The best year for Treasuries this century? That would be 2008, when they returned 20.1% — because the global economy was falling off a cliff and investors plowed money into bonds, seeking safety.
- The best year for Treasury returns since the 1920s? That would be 1982, when they returned 32.8% — amid an intensely painful recession that pushed the unemployment rate above 10%.
- There are examples that cut the other direction, as well. Some of the years remembered as boomtimes for the economy featured negative returns for bonds, as rates rose reflecting expectations of a more buoyant future. Bond investors lost 8.3% in 1999, for example, and 5% in 1987.
- To be fair, there are also plenty of examples of years that align with Bessent's framework, in which a good year for bonds coincided with a good year for the economic performance, like 1985, 1995, and 2019.
The bottom line: Bond prices move for many reasons — because of changing expectations for growth, inflation, or Fed policy; shifting appetites for U.S. dollar assets; and more.
- So while they can move in tandem with overall economic performance, they routinely move in the opposite direction.
2. K-shaped spending patterns

There is new evidence that the K-shaped economic dynamic is becoming more persistent, even when it comes to the critical holiday spending period.
By the numbers: Total card spending per household rose by 1.3% year-over-year in November, a slower pace than the 2.4% increase in October, according to new data from Bank of America.
- On a monthly basis, spending was flat in November, ending a five-month streak of gains, according to the bank's aggregated customer card data.
Spending growth was concentrated among the higher-income households, a sign that the richest consumers continue to prop up economic activity as poorer Americans pull back.
- In the three months ending in November, average spending among lower-income households rose just 0.6% from the prior-year period, compared to the 2.6% increase for higher-income counterparts.
What they're saying: "Labor market trends likely remained a key driver" of weaker spending, particularly among lower-income groups, the bank said in its report.
- After-tax pay growth continues to lag that of higher-income households, Bank of America said, though the economists noted that deceleration in lower-income wage growth earlier this year has since leveled off.
The intrigue: Bank of America says that trend was evident during a peak holiday shopping period.
- Even with relatively healthy spending patterns, the lower-income cohort saw the weakest growth in the week through Cyber Monday, behind middle- and upper-income households.
Sign up for Axios Macro